Incidence of problem gambling - Short Form PGSI individual statements
Figure 8: Percent of respondents who have experienced each of the short form PGSI statements in the last 12 months
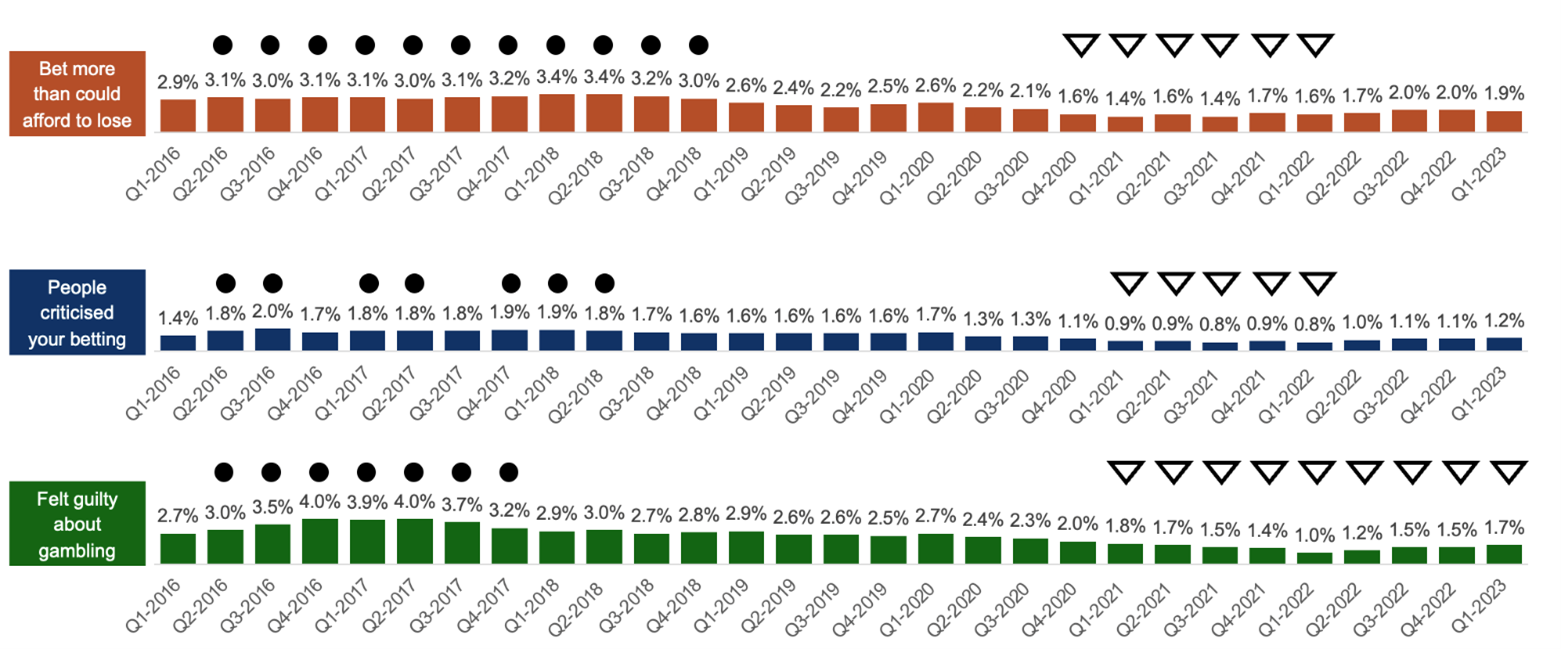
Figure 8 information
Question 7: "In the last 12 months have you bet more than you could really afford to lose?" Question 8: "In the last 12 months have people criticised your betting, or told you that you have a gambling problem, whether or not you thought it is true?" Question 9: "In the last 12 months have you felt guilty about the way you gamble or what happens when you gamble?" Base: All respondents (4000 to 4021 respondents) A filled circle is used next to data that is significantly higher than the average across the tracking period. A triangle outline is used next to data that is significantly lower than the average across the tracking period. This data is represented in the following data table.
| Quarter (Q) | Bet more than you could afford to lose | Difference between the reporting period and the average across the entire tracking period | People criticised your betting | Difference between the reporting period and the average across the entire tracking period | Felt guilty about gambling | Difference between the reporting period and the average across the entire tracking period |
|---|---|---|---|---|---|---|
| Q1 2016 | 2.9% | No significant difference | 1.4% | No significant difference | 2.7% | No significant difference |
| Q2 2016 | 3.1% | Significant increase | 1.8% | Significant increase | 3.0% | Significant increase |
| Q3 2016 | 3.0% | Significant increase | 2.0% | Significant increase | 3.5% | Significant increase |
| Q4 2016 | 3.1% | Significant increase | 1.7% | No significant difference | 4.0% | Significant increase |
| Q1 2017 | 3.1% | Significant increase | 1.8% | Significant increase | 3.9% | Significant increase |
| Q2 2017 | 3.0% | Significant increase | 1.8% | Significant increase | 4.0% | Significant increase |
| Q3 2017 | 3.1% | Significant increase | 1.8% | No significant difference | 3.7% | Significant increase |
| Q4 2017 | 3.2% | Significant increase | 1.9% | Significant increase | 3.2% | Significant increase |
| Q1 2018 | 3.4% | Significant increase | 1.9% | Significant increase | 2.9% | No significant difference |
| Q2 2018 | 3.4% | Significant increase | 1.8% | Significant increase | 3.0% | No significant difference |
| Q3 2018 | 3.2% | Significant increase | 1.7% | No significant difference | 2.7% | No significant difference |
| Q4 2018 | 3.0% | Significant increase | 1.6% | No significant difference | 2.8% | No significant difference |
| Q1 2019 | 2.6% | No significant difference | 1.6% | No significant difference | 2.9% | No significant difference |
| Q2 2019 | 2.4% | No significant difference | 1.6% | No significant difference | 2.6% | No significant difference |
| Q3 2019 | 2.2% | No significant difference | 1.6% | No significant difference | 2.6% | No significant difference |
| Q4 2019 | 2.5% | No significant difference | 1.6% | No significant difference | 2.5% | No significant difference |
| Q1 2020 | 2.6% | No significant difference | 1.7% | No significant difference | 2.7% | No significant difference |
| Q2 2020 | 2.2% | No significant difference | 1.3% | No significant difference | 2.4% | No significant difference |
| Q3 2020 | 2.1% | No significant difference | 1.3% | No significant difference | 2.3% | No significant difference |
| Q4 2020 | 1.6% | Significant decrease | 1.1% | No significant difference | 2.0% | No significant difference |
| Q1 2021 | 1.4% | Significant decrease | 0.9% | Significant decrease | 1.8% | Significant decrease |
| Q2 2021 | 1.6% | Significant decrease | 0.9% | Significant decrease | 1.7% | Significant decrease |
| Q3 2021 | 1.4% | Significant decrease | 0.8% | Significant decrease | 1.5% | Significant decrease |
| Q4 2021 | 1.7% | Significant decrease | 0.9% | Significant decrease | 1.4% | Significant decrease |
| Q1 2022 | 1.6% | Significant decrease | 0.8% | Significant decrease | 1.0% | Significant decrease |
| Q2 2022 | 1.7% | No significant difference | 1.0% | No significant difference | 1.2% | Significant decrease |
| Q3 2022 | 2.0% | No significant difference | 1.1% | No significant difference | 1.5% | Significant decrease |
| Q4 2022 | 2.0% | No significant difference | 1.1% | No significant difference | 1.5% | Significant decrease |
| Q1 2023 | 1.9% | No significant difference | 1.2% | No significant difference | 1.7% | Significant decrease |
Betting more than they can afford to lose
An average of 2.4 percent say that they have bet more than they can afford to lose in the last 12 months across the whole tracking period, with a high of 3.2 percent averaged across 2017 and 3.1 percent for 2016. This behaviour was significantly rarer in 2020 (1.6 percent across the year) and 2021 (1.7 percent). Despite a slight uptick in 2022, this percentage has still not returned to pre-pandemic levels.
The proportion betting more than they can afford to lose is significantly higher among men than women (3.1 percent versus 1.7 percent). The trend among men appears to be on a downwards trajectory – decreasing from 4.4 percent agreement in 2016 to 1.8 percent in 2021, while there is less of a distinct pattern among women.
Younger people are more likely to have bet more than they can afford to lose than older people (3.8 percent of those aged 16 to 24 versus 1.4 percent of those aged 65+), potentially linked to the disposable income that these age groups have. The proportion of over 65s agreeing with this statement reached a low of 0.3 percent in 2020 during the pandemic, down from 2.5 percent in 2016 and 1.1 percent in 2019. While rates of betting more than they can afford to lose have begun to increase in 2021 (1.3 percent) and 2022 (1.6 percent) they are still significantly lower than where they were prior to 2019, with the cost of living crisis potentially also having an impact on lower participation rates.
People criticising their betting
Across the tracking period 1.4 percent report having been criticised about their betting or told that they have a gambling problem. The proportion reporting this was on a downwards trajectory from 2018 until the beginning of 2022. Although having seen a slight upwards trend, rates remain below where they were pre-pandemic.
Men are more likely to be criticised for their betting than women (2.2 percent over the tracking period versus 0.7 percent for women), with men also driving the trend towards less criticism, from an average of 3.1 percent in 2017 decreasing annually to 1.1 percent in 2021. While returning to 1.5 percent in 2022 it is still significantly behind where it was prior to the pandemic.
Younger people are significantly more likely to have been criticised for their gambling behaviours than older people (2.8 percent of 16 to 24 year olds versus 0.5 percent of those aged 65 and over). Criticism of older people’s gambling habits decreased to nothing in 2020 during the Covid-19 pandemic, with only 0.2 percent reporting this in 2021.
Feeling guilty about the way they gamble or what happens when they gamble
2.5 percent of people reported feeling guilty about their gambling over the tracking period. Guilt was highest in 2016 (4 percent) and 2017 (3.2 percent). These feelings have been on a gradual decline since, with just 1.5 percent of respondents reporting this guilt in Quarter 4 2022.
As well as being more likely to bet more than they can afford to lose, men are also significantly more likely to feel guilt than women (3.6 percent versus 1.4 percent), with men experiencing a particularly peak in 2016 (6 percent experiencing these feelings of guilt). Consistent with the overall trend, both men and women have seen a reduction in their guilty feelings since 2016.
As well as being the most likely to have bet more than they can afford to lose and to have been criticised about their gambling, those aged 16 to 24 are also most likely to feel guilty about their gambling (4.0 percent). There is less of a clear downwards trend in terms of guilt among this age group.
Those aged 65 and over are the least likely to have felt guilty about their gambling behaviours across the period (0.7 percent), with lows of 0.3 percent in 2020 and 0.2 percent in 2021.
Previous pageGambling Behaviour 2015 to 2023: Incidence of problem gambling – Short Form PGSI Next page
Gambling Behaviour 2015 to 2023: Key Conclusions
Last updated: 11 May 2023
Show updates to this content
No changes to show.