Perceptions of the gambling industry as fair and trusted
Figure 5: Percent who agree and/or disagree that ‘gambling is conducted fairly and can be trusted in this country’
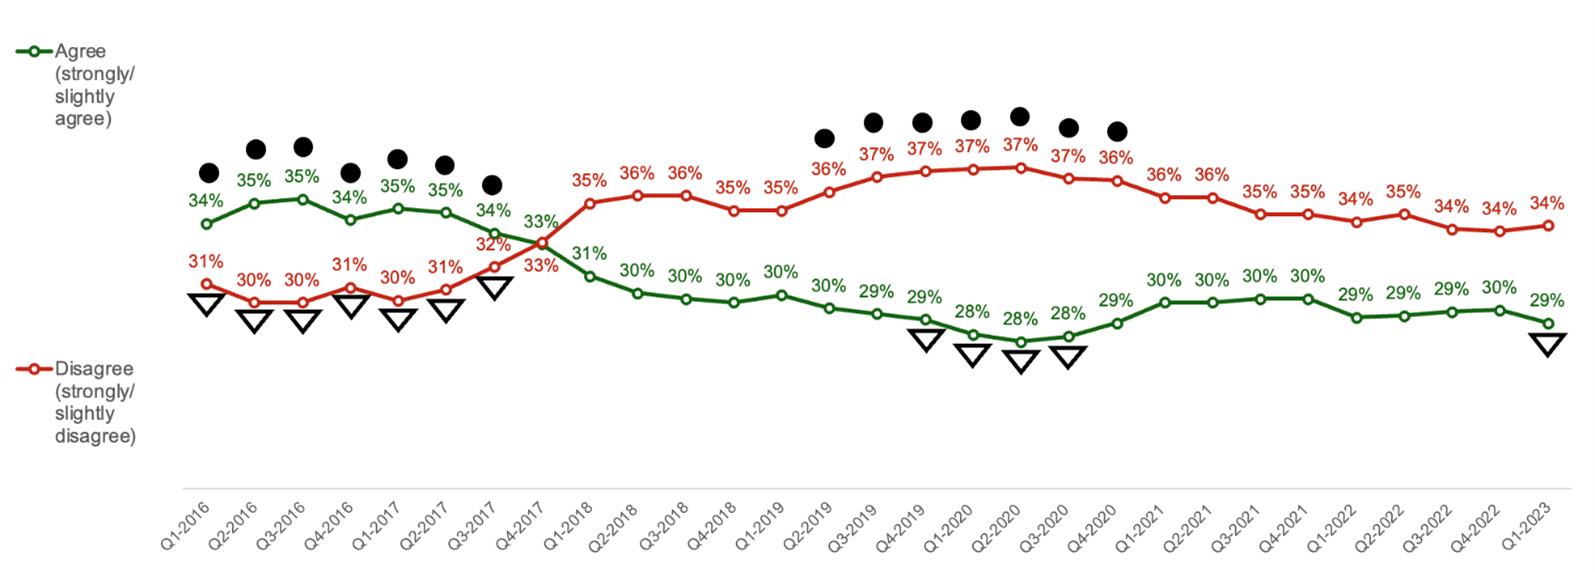
Figure 5 information
Question 11: "How far do you agree or disagree that in this country, gambling is conducted fairly and can be trusted?"
Base: All respondents each quarter (4000 to 4021 respondents)
A filled circle is used next to data that is significantly higher than the average across the tracking period. A triangle outline is used next to data that is significantly lower than the average across the tracking period. This data is represented in the following data table.
| Quarter (Q) | Agree | Difference between the reporting period and the average across the entire tracking period | Disagree | Difference between the reporting period and the average across the entire tracking period |
|---|---|---|---|---|
| Q1 2016 | 34% | Significant increase | 31% | Significant decrease |
| Q2 2016 | 35% | Significant increase | 30% | Significant decrease |
| Q3 2016 | 35% | Significant increase | 30% | Significant decrease |
| Q4 2016 | 34% | Significant increase | 31% | Significant decrease |
| Q1 2017 | 35% | Significant increase | 30% | Significant decrease |
| Q2 2017 | 35% | Significant increase | 31% | Significant decrease |
| Q3 2017 | 34% | Significant increase | 32% | Significant decrease |
| Q4 2017 | 33% | No significant difference | 33% | No significant difference |
| Q1 2018 | 31% | No significant difference | 35% | No significant difference |
| Q2 2018 | 30% | No significant difference | 36% | No significant difference |
| Q3 2018 | 30% | No significant difference | 36% | No significant difference |
| Q4 2018 | 30% | No significant difference | 35% | No significant difference |
| Q1 2019 | 30% | No significant difference | 35% | No significant difference |
| Q2 2019 | 30% | No significant difference | 36% | Significant increase |
| Q3 2019 | 29% | No significant difference | 37% | Significant increase |
| Q4 2019 | 29% | Significant decrease | 37% | Significant increase |
| Q1 2020 | 28% | Significant decrease | 37% | Significant increase |
| Q2 2020 | 28% | Significant decrease | 37% | Significant increase |
| Q3 2020 | 28% | Significant decrease | 37% | Significant increase |
| Q4 2020 | 29% | No significant difference | 36% | Significant increase |
| Q1 2021 | 30% | No significant difference | 36% | No significant difference |
| Q2 2021 | 30% | No significant difference | 36% | No significant difference |
| Q3 2021 | 30% | No significant difference | 35% | No significant difference |
| Q4 2021 | 30% | No significant difference | 35% | No significant difference |
| Q1 2022 | 29% | No significant difference | 34% | No significant difference |
| Q2 2022 | 29% | No significant difference | 35% | No significant difference |
| Q3 2022 | 29% | No significant difference | 34% | No significant difference |
| Q4 2022 | 30% | No significant difference | 34% | No significant difference |
| Q1 2023 | 29% | Significant decrease | 34% | No significant difference |
Overall agreement that gambling is conducted fairly and can be trusted in this country averaged 31 percent over the tracking period. Agreement was significantly higher than the average in 2016 (34 percent) and 2017 (33 percent), while perceptions were significantly lower than average in 2019 (29 percent). Participants were more likely to agree than disagree with this statement up until Quarter 1 2018, when the trend switched and disagreement became more widespread.
Men were significantly more likely to agree with the statement than women (36 percent versus 26 percent), while women’s attitudes were more variable over the tracking period.
Gamblers were significantly more likely to agree that gambling is conducted fairly and can be trusted than non-gamblers (39 percent versus 27 percent). Levels of agreement among non-gamblers remained relatively consistent across the period, while gamblers saw a significant peak in agreement in 2016 and 2017 (44 percent), with a low in 2019 (36 percent).
Those classified as low and moderate risk gamblers according to the Short Form Problem Gambling Severity Index are most likely to feel the sector can be fair and trusted (43 percent and 42 percent agree respectively), with levels of agreement remaining consistent over the period.
Across the tracking period as a whole, those classified as problem gamblers and non-problem gamblers are least likely to agree that the industry is fair and can be trusted (39 percent and 34 percent respectively), with close to half of problem gamblers disagreeing with the statement (49 percent). While non-problem gamblers saw a peak in agreement in 2016 and 2017 (37 percent) alongside a low of 31 percent in 2019 and 2020, low base sizes mean that trends among those classified as problem gamblers are unable to be further explored.
Previous pageGambling Behaviour 2015 to 2023: Scratchcard, sports betting, fruit machines, slots and instant win games participation Next page
Gambling Behaviour 2015 to 2023: Incidence of problem gambling – Short Form PGSI
Last updated: 11 May 2023
Show updates to this content
No changes to show.