Incidence of problem gambling – Short Form PGSI
Figure 6: Percent classified as non-problem gamblers
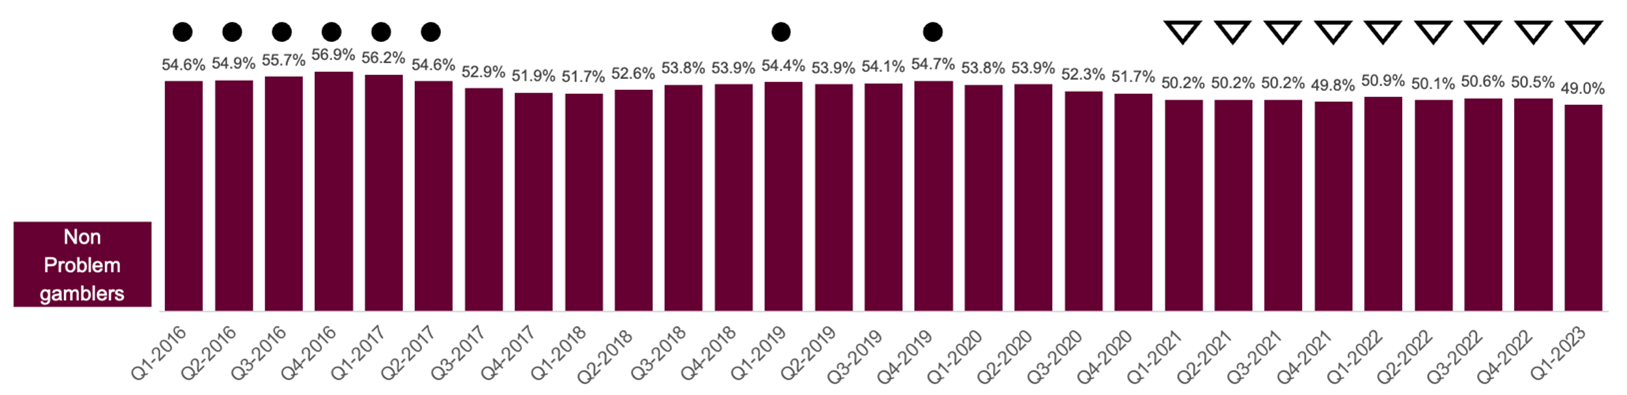
Figure 6 information
Short Form Problem Gambling Severity Index (PGSI): Percentage of respondents classified as non problem gamblers1 Base: All respondents each quarter (4000 to 4021 respondents) A filled circle is used next to data that is significantly higher than the average across the tracking period. A triangle outline is used next to data that is significantly lower than the average across the tracking period. This data is represented in the following data table.
| Quarter (Q) | Non-Problem Gamblers (Score of 0 on short-form PGSI) (percentage) | Difference between the reporting period and the average across the entire tracking period |
|---|---|---|
| Q1 2016 | 54.6% | Significant increase |
| Q2 2016 | 54.9% | Significant increase |
| Q3 2016 | 55.7% | Significant increase |
| Q4 2016 | 56.9% | Significant increase |
| Q1 2017 | 56.2% | Significant increase |
| Q2 2017 | 54.6% | Significant increase |
| Q3 2017 | 52.9% | No significant difference |
| Q4 2017 | 51.9% | No significant difference |
| Q1 2018 | 51.7% | No significant difference |
| Q2 2018 | 52.6% | No significant difference |
| Q3 2018 | 53.8% | No significant difference |
| Q4 2018 | 53.9% | No significant difference |
| Q1 2019 | 54.4% | Significant increase |
| Q2 2019 | 53.9% | No significant difference |
| Q3 2019 | 54.1% | No significant difference |
| Q4 2019 | 54.7% | Significant increase |
| Q1 2020 | 53.8% | No significant difference |
| Q2 2020 | 53.9% | No significant difference |
| Q3 2020 | 52.3% | No significant difference |
| Q4 2020 | 51.7% | No significant difference |
| Q1 2021 | 50.2% | Significant decrease |
| Q2 2021 | 50.2% | Significant decrease |
| Q3 2021 | 50.2% | Significant decrease |
| Q4 2021 | 49.8% | Significant decrease |
| Q1 2022 | 50.9% | Significant decrease |
| Q2 2022 | 50.1% | Significant decrease |
| Q3 2022 | 50.6% | Significant decrease |
| Q4 2022 | 50.5% | Significant decrease |
| Q1 2023 | 49.0% | Significant decrease |
An average of 53 percent were classified as non-problem gamblers across the 2015 to 2023 tracking period. The prevalence of non-problem gamblers was lowest in 2021 and 2022 (50 percent and 51 percent respectively), when the prevalence of non-gamblers increased. Rates were significantly higher in 2016, with 57 percent being classified as non-problem gamblers and significantly fewer non-gamblers.
Men were significantly more likely to be classed as non-problem gamblers than women (54 percent versus 52 percent), although women were more likely not to have gambled at all (45 percent versus 40 percent). Likelihood to be a non-problem gambler increases with age. Across the period, 42 percent of those aged 16 to 24 were classified as non-problem gamblers compared to 48 percent of those aged 65 and over.
Figure 7: Percent classified as problem gamblers and/or moderate risk gamblers and/or low risk gamblers
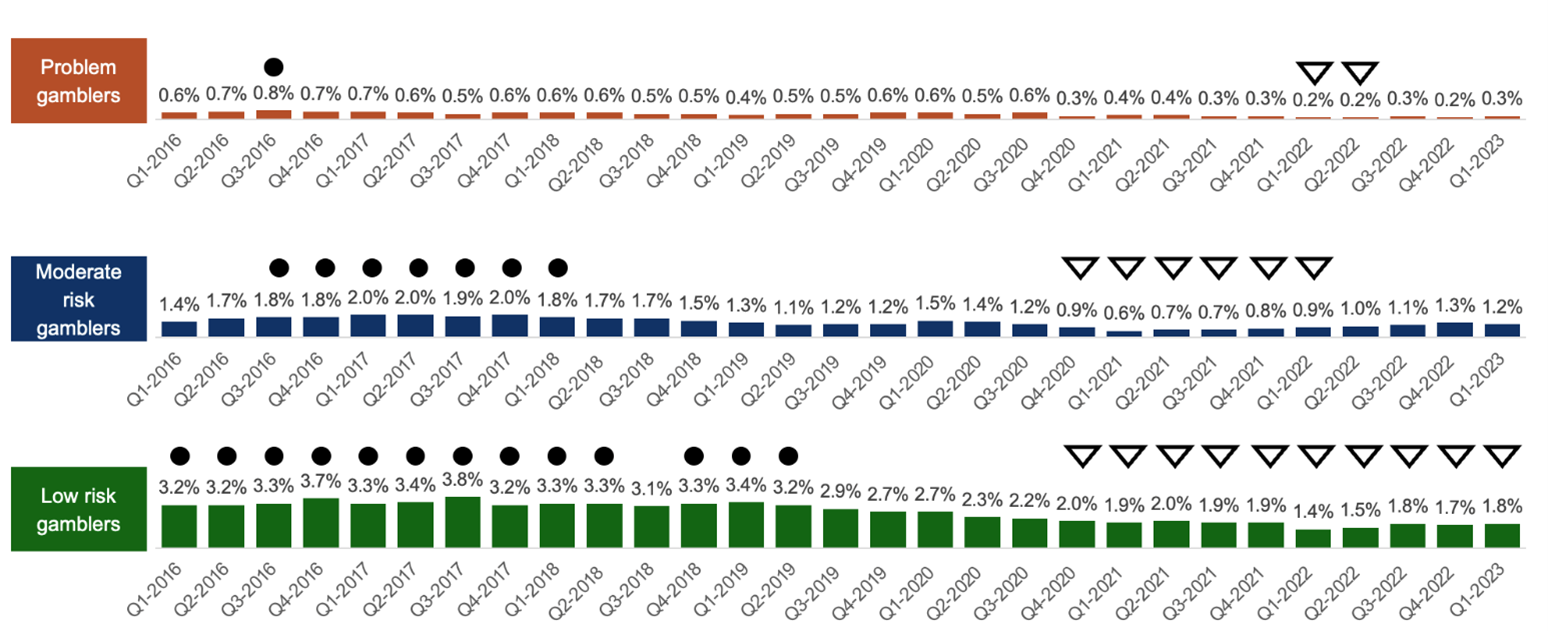
Figure 7 information
Short Form Problem Gambling Severity Index: Percentage of respondents classified as problem gamblers, moderate risk gamblers and low risk gamblers Base: All respondents each quarter (4000 to 4021 respondents) A filled circle is used next to data that is significantly higher than the average across the tracking period. A triangle outline is used next to data that is significantly lower than the average across the tracking period. This data is represented in the following data table.
| Quarter (Q) | Problem gamblers (Score of 4 or more on the short-form PGSI) | Difference between the reporting period and the average across the entire tracking period | Moderate risk gamblers (Score of 2 to 3 on the short-form PGSI) | Difference between the reporting period and the average across the entire tracking period | Low risk gamblers (Score of 1 on the short-form PGSI) | Difference between the reporting period and the average across the entire tracking period |
|---|---|---|---|---|---|---|
| Q1 2016 | 0.6% | No significant difference | 1.4% | No significant difference | 3.2% | Significant increase |
| Q2 2016 | 0.7% | No significant difference | 1.7% | No significant difference | 3.2% | Significant increase |
| Q3 2016 | 0.8% | Significant increase | 1.8% | Significant increase | 3.3% | Significant increase |
| Q4 2016 | 0.7% | No significant difference | 1.8% | Significant increase | 3.7% | Significant increase |
| Q1 2017 | 0.7% | No significant difference | 2.0% | Significant increase | 3.3% | Significant increase |
| Q2 2017 | 0.6% | No significant difference | 2.0% | Significant increase | 3.4% | Significant increase |
| Q3 2017 | 0.5% | No significant difference | 1.9% | Significant increase | 3.8% | Significant increase |
| Q4 2017 | 0.6% | No significant difference | 2.0% | Significant increase | 3.2% | Significant increase |
| Q1 2018 | 0.6% | No significant difference | 1.8% | Significant increase | 3.3% | Significant increase |
| Q2 2018 | 0.6% | No significant difference | 1.7% | No significant difference | 3.3% | Significant increase |
| Q3 2018 | 0.5% | No significant difference | 1.7% | No significant difference | 3.1% | No significant difference |
| Q4 2018 | 0.5% | No significant difference | 1.5% | No significant difference | 3.3% | Significant increase |
| Q1 2019 | 0.4% | No significant difference | 1.3% | No significant difference | 3.4% | Significant increase |
| Q2 2019 | 0.5% | No significant difference | 1.1% | No significant difference | 3.2% | Significant increase |
| Q3 2019 | 0.5% | No significant difference | 1.2% | No significant difference | 2.9% | No significant difference |
| Q4 2019 | 0.6% | No significant difference | 1.2% | No significant difference | 2.7% | No significant difference |
| Q1 2020 | 0.6% | No significant difference | 1.5% | No significant difference | 2.7% | No significant difference |
| Q2 2020 | 0.5% | No significant difference | 1.4% | No significant difference | 2.3% | No significant difference |
| Q3 2020 | 0.6% | No significant difference | 1.2% | No significant difference | 2.2% | No significant difference |
| Q4 2020 | 0.3% | No significant difference | 0.9% | Significant decrease | 2.0% | Significant decrease |
| Q1 2021 | 0.4% | No significant difference | 0.6% | Significant decrease | 1.9% | Significant decrease |
| Q2 2021 | 0.4% | No significant difference | 0.7% | Significant decrease | 2.0% | Significant decrease |
| Q3 2021 | 0.3% | No significant difference | 0.7% | Significant decrease | 1.9% | Significant decrease |
| Q4 2021 | 0.3% | No significant difference | 0.8% | Significant decrease | 1.9% | Significant decrease |
| Q1 2022 | 0.2% | Significant decrease | 0.9% | Significant decrease | 1.4% | Significant decrease |
| Q2 2022 | 0.2% | Significant decrease | 1.0% | No significant difference | 1.5% | Significant decrease |
| Q3 2022 | 0.3% | No significant difference | 1.1% | No significant difference | 1.8% | Significant decrease |
| Q4 2022 | 0.2% | No significant difference | 1.3% | No significant difference | 1.7% | Significant decrease |
| Q1 2023 | 0.3% | No significant difference | 1.2% | No significant difference | 1.8% | Significant decrease |
Problem gambling has averaged 0.5 percent over the period, with the incidence of problem gambling significantly lower in Quarter 1 and Quarter 2 2022 and higher during Quarter 3 2016. Men are significantly more likely to be classified as problem gamblers than women (0.8 percent versus 0.2 percent), while younger people are more likely to be classified as problem gamblers than older people (0.9 percent of 16 to 24 year olds versus 0.1 percent of those aged 65 and over).
1.4 percent were classified as moderate risk gamblers over the tracking period, with lows in 2020 (0.9 percent average across the year) and 2021 (0.8 percent) and a high in 2017 (2.0 percent). Men were more likely to be classified as moderate risk (1.9 percent) than women (0.9 percent), while 16 to 24 year olds were more likely to be classified as moderate risk than those aged 65 and over (2.2 percent versus 0.5 percent).
The incidence of low-risk gamblers averaged 2.6 percent across the tracking period, with a peak of 3.7 percent in 2016 and a low of 1.7 percent in 2022. Men were again more likely to be classified as low risk gamblers than women (3.5 percent versus 1.8 percent), while younger people were again more likely to be classified as low risk than older people (4.2 percent of 16 to 24 year olds versus 1.4 percent of those aged 65 and over).
Notes
1 For more information on the Short Form PGSI see: Developing a Short Form of the PGSI (PDF) (opens in new tab).
Previous pageGambling Behaviour 2015 to 2023: Perceptions of the gambling industry as fair and trusted Next page
Gambling Behaviour 2015 to 2023: Short Form PGSI individual statements
Last updated: 11 May 2023
Show updates to this content
No changes to show.