Scratchcard, sports betting, fruit machines, slots and instant win games participation
Scratchcard participation in the past four weeks
Scratchcard purchases peaked in Quarter 1 2017 at 13 percent but have seen a decline since, culminating with a low of 7 percent in Quarter 1 2021, which has remained relatively unchanged since.
Scratchcard purchase is consistent by gender, with 9 percent of men and 10 percent of women having purchased these over the course of the tracking period. Both men and women have seen a decrease in participation since 2020 which has not returned to pre-pandemic levels.
Participation rates are highest among those aged 25 to 34 (14 percent) and 16 to 24 year olds (12 percent), while just 5 percent of those aged 65 and over have participated. The decline in participation following the pandemic has mainly been driven by decreases among the younger age groups and those aged 65 and over. Participation has remained more consistent annually among the other age groups.
Figure 4: Percent who have spent any money on selected gambling activities in the past 4 weeks
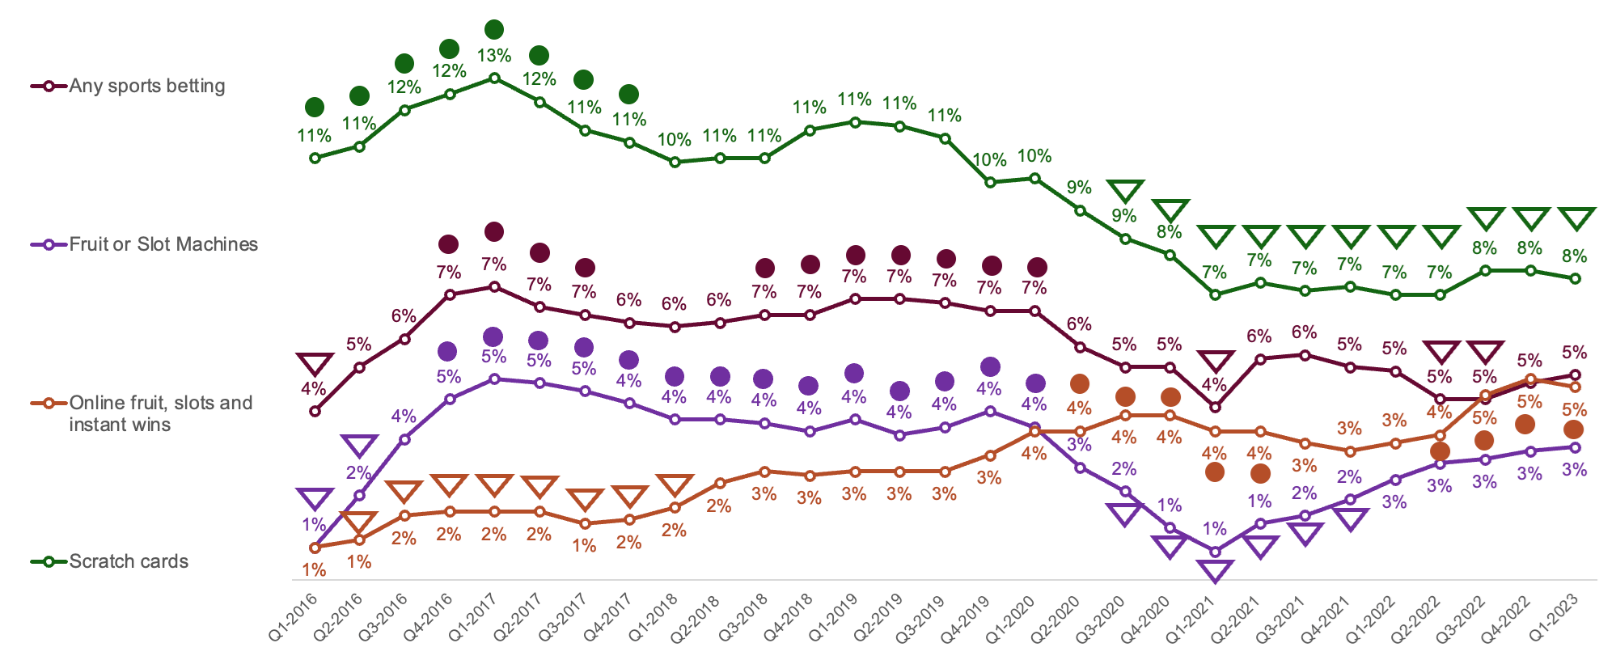
Figure 4 information
Question 1a: "I’m going to read out a list of activities. Please tell me whether you have spent any money on each one in the past four weeks, that is since [text fill date four weeks ago]." Base: All respondents each quarter (4000 to 4021 respondents) A filled circle is used next to data that is significantly higher than the average across the tracking period. A triangle outline is used next to data that is significantly lower than the average across the tracking period. This data is represented in the following data table. Note: the online fruit, slots and instant wins category was expanded from Quarter 1 2018 data to include participation in National Lottery Online Instant Wins. The Fruit or Slot Machines category was expanded from Quarter 2 2016 to include Fruit or Slot Machines at bingo halls.
| Quarter (Q) | Any Sports betting (including horses, dogs, football, tennis, other sporting events) | Difference between the reporting period and the average across the entire tracking period | Fruit or Slot Machines | Difference between the reporting period and the average across the entire tracking period | Online fruit, slots and instant wins | Difference between the reporting period and the average across the entire tracking period | Scratch cards | Difference between the reporting period and the average across the entire tracking period |
|---|---|---|---|---|---|---|---|---|
| Q1 2016 | 4% | Significant decrease | 1% | Significant decrease | 1% | Significant decrease | 11% | Significant increase |
| Q2 2016 | 5% | No significant difference | 2% | Significant decrease | 1% | Significant decrease | 11% | Significant increase |
| Q3 2016 | 6% | No significant difference | 4% | No significant difference | 2% | Significant decrease | 12% | Significant increase |
| Q4 2016 | 7% | Significant increase | 5% | Significant increase | 2% | Significant decrease | 12% | Significant increase |
| Q1 2017 | 7% | Significant increase | 5% | Significant increase | 2% | Significant decrease | 13% | Significant increase |
| Q2 2017 | 7% | Significant increase | 5% | Significant increase | 2% | Significant decrease | 12% | Significant increase |
| Q3 2017 | 7% | Significant increase | 5% | Significant increase | 1% | Significant decrease | 11% | Significant increase |
| Q4 2017 | 6% | No significant difference | 4% | Significant increase | 2% | Significant decrease | 11% | Significant increase |
| Q1 2018 | 6% | No significant difference | 4% | Significant increase | 2% | Significant decrease | 10% | No significant difference |
| Q2 2018 | 6% | No significant difference | 4% | Significant increase | 2% | No significant difference | 11% | No significant difference |
| Q3 2018 | 7% | Significant increase | 4% | Significant increase | 3% | No significant difference | 11% | No significant difference |
| Q4 2018 | 7% | Significant increase | 4% | Significant increase | 3% | No significant difference | 11% | No significant difference |
| Q1 2019 | 7% | Significant increase | 4% | Significant increase | 3% | No significant difference | 11% | No significant difference |
| Q2 2019 | 7% | Significant increase | 4% | Significant increase | 3% | No significant difference | 11% | No significant difference |
| Q3 2019 | 7% | Significant increase | 4% | Significant increase | 3% | No significant difference | 11% | No significant difference |
| Q4 2019 | 7% | Significant increase | 4% | Significant increase | 3% | No significant difference | 10% | No significant difference |
| Q1 2020 | 7% | Significant increase | 4% | Significant increase | 4% | No significant difference | 10% | No significant difference |
| Q2 2020 | 6% | No significant difference | 3% | No significant difference | 4% | Significant increase | 9% | No significant difference |
| Q3 2020 | 5% | No significant difference | 2% | Significant decrease | 4% | Significant increase | 9% | Significant decrease |
| Q4 2020 | 5% | No significant difference | 1% | Significant decrease | 4% | Significant increase | 8% | Significant decrease |
| Q1 2021 | 4% | Significant decrease | 1% | Significant decrease | 4% | Significant increase | 7% | Significant decrease |
| Q2 2021 | 6% | No significant difference | 1% | Significant decrease | 4% | Significant increase | 7% | Significant decrease |
| Q3 2021 | 6% | No significant difference | 2% | Significant decrease | 3% | No significant difference | 7% | Significant decrease |
| Q4 2021 | 5% | No significant difference | 2% | Significant decrease | 3% | No significant difference | 7% | Significant decrease |
| Q1 2022 | 5% | No significant difference | 3% | No significant difference | 3% | No significant difference | 7% | Significant decrease |
| Q2 2022 | 5% | Significant decrease | 3% | No significant difference | 4% | Significant increase | 7% | Significant decrease |
| Q3 2022 | 5% | Significant decrease | 3% | No significant difference | 5% | Significant increase | 8% | Significant decrease |
| Q4 2022 | 5% | No significant difference | 3% | No significant difference | 5% | Significant increase | 8% | Significant decrease |
| Q1 2023 | 5% | No significant difference | 3% | No significant difference | 5% | Significant increase | 8% | Significant decrease |
Sports betting participation
This includes betting on horse races, dog races, football, tennis or other sporting events in the past 4 weeks.
Participation rates for any sports betting was 6 percent over the tracking period. Similarly to gambling through other in-person methods, participation decreased during the Covid-19 period, to a statistically significant low of 4 percent in Quarter 1 2021.
Men were significantly more likely to have participated in sports betting than women over the tracking period (10 percent compared to 1 percent), with both genders experiencing a decline in participation over 2020 to early 2021.
Those aged 16 to 24 and 25 to 34 were most likely to participate in sports betting (10 percent and 11 percent), with this predominantly made up of betting on football (8 percent and 9 percent respectively). These age groups did not experience a notable decline in participation during the pandemic, remaining at an 11 percent and 9 percent average across 2020. Just 1 percent of those aged 65 and over participated in sports betting across the period.
Fruit and slot machine participation
This includes using fruit or slot machines in pubs, gaming centres and/or arcades, casinos or bingo halls, or virtual gaming machines in a bookmaker’s in the past four weeks.
3 percent used fruit and slot machines over the tracking period. Participation decreased significantly during the Covid-19 pandemic, to a low of 1 percent in Quarter 1 2021. Rates began to increase again from Quarter 2 2021, although they are still behind where they were in 2017.
Men were more likely to use fruit and slot machines than women over the period (4 percent versus 2 percent), while 16 to 24 year olds were the most likely age group to participate (8 percent). All demographic groups saw a significant decline in participation during the pandemic.
Online fruit, slots and instant wins participation
This includes using online fruit and/or slot machine style games or online instant win games and/or National Lottery Online Instant Wins in the past four weeks.
An average of 3 percent had participated in online fruit, slots and instant wins over the tracking period. This gambling category did not see the same impact as in-person activities during Covid-19, with participation generally increasing over the period. Participation reached a high of 5 percent in Quarter 1 2023, significantly higher than 1 percent when tracking began. A change to how the category was measured in the survey, with the inclusion of National Lottery instant wins in Quarter 4 2017, may have also had an impact on these participation rates.
Participation is consistent across gender, with both men and women experiencing an increase in participation across the tracking period.
Participation is highest among those aged 25 to 34 and 35 to 44, with both experiencing an average of 4 percent across the period. Those aged 65 and over are least likely to have participated in online fruit, slots and instant wins (1 percent). Nonetheless, similarly to other age groups their participation has increased over time – from less than one percent across 2015 to 2019, to 2 percent in 2022.
Previous pageGambling Behaviour 2015 to 2023: Lottery participation Next page
Gambling Behaviour 2015 to 2023: Perceptions of the gambling industry as fair and trusted
Last updated: 13 July 2023
Show updates to this content
Formatting issues corrected.