Lottery participation
Lottery participation
This includes purchased tickets for the National Lottery draws (Lotto, Euromillions, Thunderball, Set for Life, Hotpicks), a charity lottery or other lottery in the past four weeks.
Figure 2: Percent who have spent money on any Lottery participation in the past 4 weeks
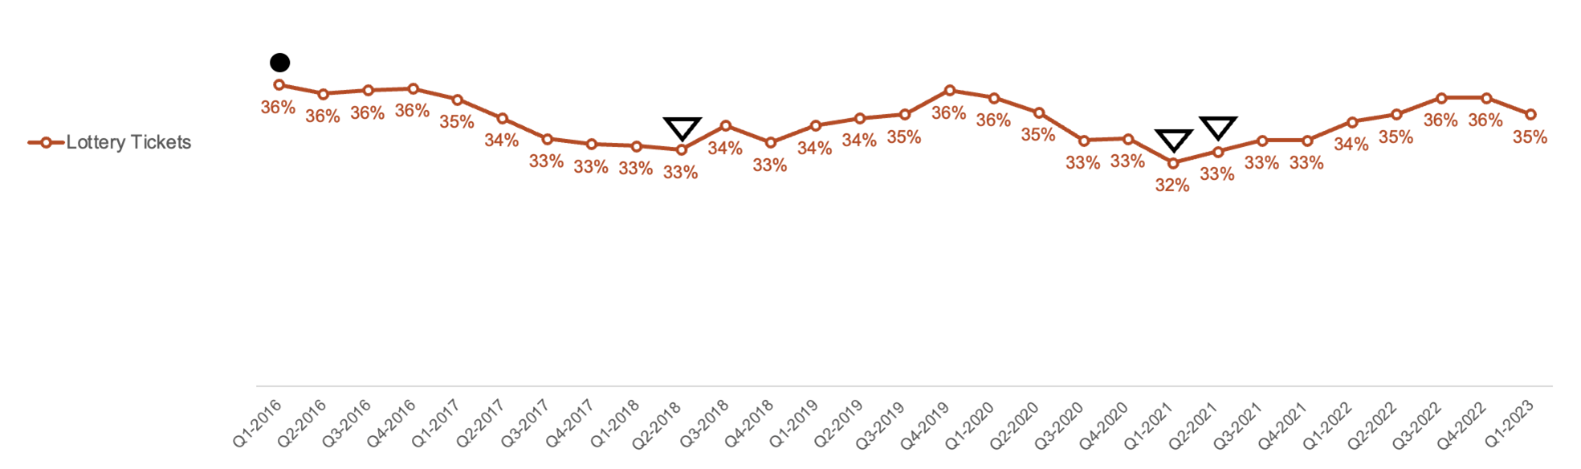
Figure 2 information
Question 1a: "I’m going to read out a list of activities. Please tell me whether you have spent any money on each one in the past four weeks, that is since [text fill date four weeks ago]." Base: All respondents each quarter (4000 to 4021 respondents) A filled circle is used next to data that is significantly higher than the average across the tracking period. A triangle outline is used next to data that is significantly lower than the average across the tracking period. This data is represented in the following data table.
| Quarter (Q) | Purchased any Lottery Tickets in the last 4 weeks (including National Lottery, a charity lottery or another lottery) (percentage) | Difference between the reporting period and the average across the entire tracking period |
|---|---|---|
| Q1 2016 | 36% | Significant increase |
| Q2 2016 | 36% | No significant difference |
| Q3 2016 | 36% | No significant difference |
| Q4 2016 | 36% | No significant difference |
| Q1 2017 | 35% | No significant difference |
| Q2 2017 | 34% | No significant difference |
| Q3 2017 | 33% | No significant difference |
| Q4 2017 | 33% | No significant difference |
| Q1 2018 | 33% | No significant difference |
| Q2 2018 | 33% | Significant decrease |
| Q3 2018 | 34% | No significant difference |
| Q4 2018 | 33% | No significant difference |
| Q1 2019 | 34% | No significant difference |
| Q2 2019 | 34% | No significant difference |
| Q3 2019 | 35% | No significant difference |
| Q4 2019 | 36% | No significant difference |
| Q1 2020 | 36% | No significant difference |
| Q2 2020 | 35% | No significant difference |
| Q3 2020 | 33% | No significant difference |
| Q4 2020 | 33% | No significant difference |
| Q1 2021 | 32% | Significant decrease |
| Q2 2021 | 33% | Significant decrease |
| Q3 2021 | 33% | No significant difference |
| Q4 2021 | 33% | No significant difference |
| Q1 2022 | 34% | No significant difference |
| Q2 2022 | 35% | No significant difference |
| Q3 2022 | 36% | No significant difference |
| Q4 2022 | 36% | No significant difference |
| Q1 2023 | 35% | No significant difference |
Lottery participation averaged 34 percent over the tracking period. Participation remained relatively consistent over the period, with the only significant increase of 36 percent in Quarter 1 2016. A slight downwards trend was seen with the outbreak of Covid-19 cumulating with a low of 32 percent participation in Quarter 1 2021.
Participation rates were relatively similar by gender across the period, with 35 percent of men and 34 percent of women purchasing lottery tickets. Women’s participation remained stable during the Covid-19 period, with men predominantly driving the overall decreases seen in 2020 and beginning of 2021.
Lottery participation differs by age group, with only 12 percent of 16 to 24 year olds having purchased a ticket across the tracking period, compared to 44 percent of those aged 45 to 54 and 55 to 64. Those aged 25 to 34 and those aged 65 and over drove the significant decrease in participation seen in Quarter 1 and Quarter 2 2021, with participation among other age groups remaining more stable.
Figure 3: Percent who have spent money on Lottery participation in person and/or online in the last 4 weeks
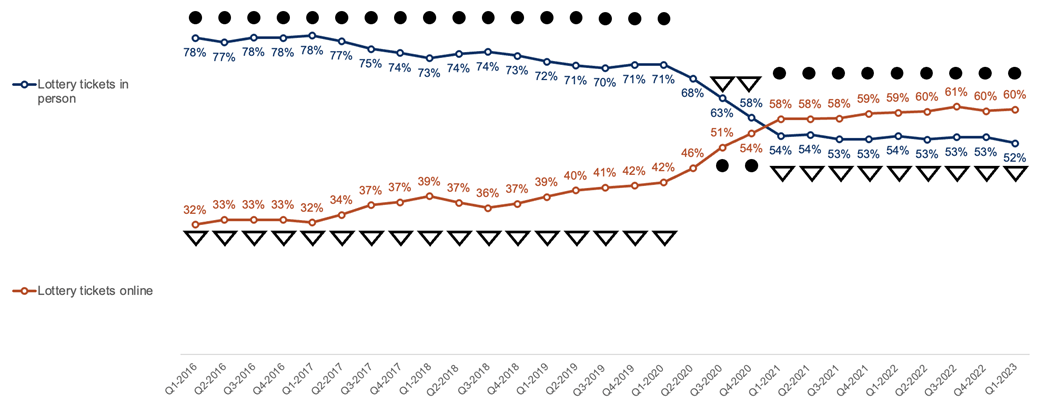
Figure 3 information
Question 2: "And, in the last 4 weeks, did you spend money on [insert answer at Q1a] in person, online or both?" Base: All respondents who had bought lottery tickets each quarter (1300 to 1471 respondents) A filled circle is used next to data that is significantly higher than the average across the tracking period. A triangle outline is used next to data that is significantly lower than the average across the tracking period. This data is represented in the following data table. Note: figures for each wave do not sum to 100 percent due to some respondents purchasing tickets both online and in-person.
| Quarter (Q) | Lottery tickets in person | Difference between the reporting period and the average across the entire tracking period | Lottery tickets online | Difference between the reporting period and the average across the entire tracking period |
|---|---|---|---|---|
| Q1 2016 | 78% | Significant increase | 32% | Significant decrease |
| Q2 2016 | 77% | Significant increase | 33% | Significant decrease |
| Q3 2016 | 78% | Significant increase | 33% | Significant decrease |
| Q4 2016 | 78% | Significant increase | 33% | Significant decrease |
| Q1 2017 | 78% | Significant increase | 32% | Significant decrease |
| Q2 2017 | 77% | Significant increase | 34% | Significant decrease |
| Q3 2017 | 75% | Significant increase | 37% | Significant decrease |
| Q4 2017 | 74% | Significant increase | 37% | Significant decrease |
| Q1 2018 | 73% | Significant increase | 39% | Significant decrease |
| Q2 2018 | 74% | Significant increase | 37% | Significant decrease |
| Q3 2018 | 74% | Significant increase | 36% | Significant decrease |
| Q4 2018 | 73% | Significant increase | 37% | Significant decrease |
| Q1 2019 | 72% | Significant increase | 39% | Significant decrease |
| Q2 2019 | 71% | Significant increase | 40% | Significant decrease |
| Q3 2019 | 70% | Significant increase | 41% | Significant decrease |
| Q4 2019 | 71% | Significant increase | 42% | Significant decrease |
| Q1 2020 | 71% | Significant increase | 42% | Significant decrease |
| Q2 2020 | 68% | No significant difference | 46% | No significant difference |
| Q3 2020 | 63% | Significant decrease | 51% | Significant increase |
| Q4 2020 | 58% | Significant decrease | 54% | Significant increase |
| Q1 2021 | 54% | Significant decrease | 58% | Significant increase |
| Q2 2021 | 54% | Significant decrease | 58% | Significant increase |
| Q3 2021 | 53% | Significant decrease | 58% | Significant increase |
| Q4 2021 | 53% | Significant decrease | 59% | Significant increase |
| Q1 2022 | 54% | Significant decrease | 59% | Significant increase |
| Q2 2022 | 53% | Significant decrease | 60% | Significant increase |
| Q3 2022 | 53% | Significant decrease | 61% | Significant increase |
| Q4 2022 | 53% | Significant decrease | 60% | Significant increase |
| Q1 2023 | 52% | Significant decrease | 60% | Significant increase |
There has been a switch in behaviour from in-person to online Lottery ticket purchases over the tracking period. While in-person purchases were more popular than online when tracking began, they saw a strong decline beginning in Quarter 2 2020 and continuing to Quarter 1 2021. Online became the most popular purchase method for Lottery tickets in Quarter 1 2021 and has remained the preferred method since.
Men and women were equally likely to be purchasing tickets in person (66 percent and 67 percent respectively) or online (45 percent and 45 percent respectively) across the tracking period. Both also experienced the same decrease in in person purchases driven by Covid-19, with online lottery tickets overtaking in person purchases.
Those aged 65 and over were the only age group not to have seen online replace in person as the most popular purchase method over the period.
Previous pageGambling Behaviour 2015 to 2023: Gambling participation over time Next page
Gambling Behaviour 2015 to 2023: Scratchcard, sports betting, fruit machines, slots and instant win games participation
Last updated: 11 May 2023
Show updates to this content
No changes to show.