Gambling participation over time
Figure 1: Percent who have spent any money on gambling activities in the past 4 weeks
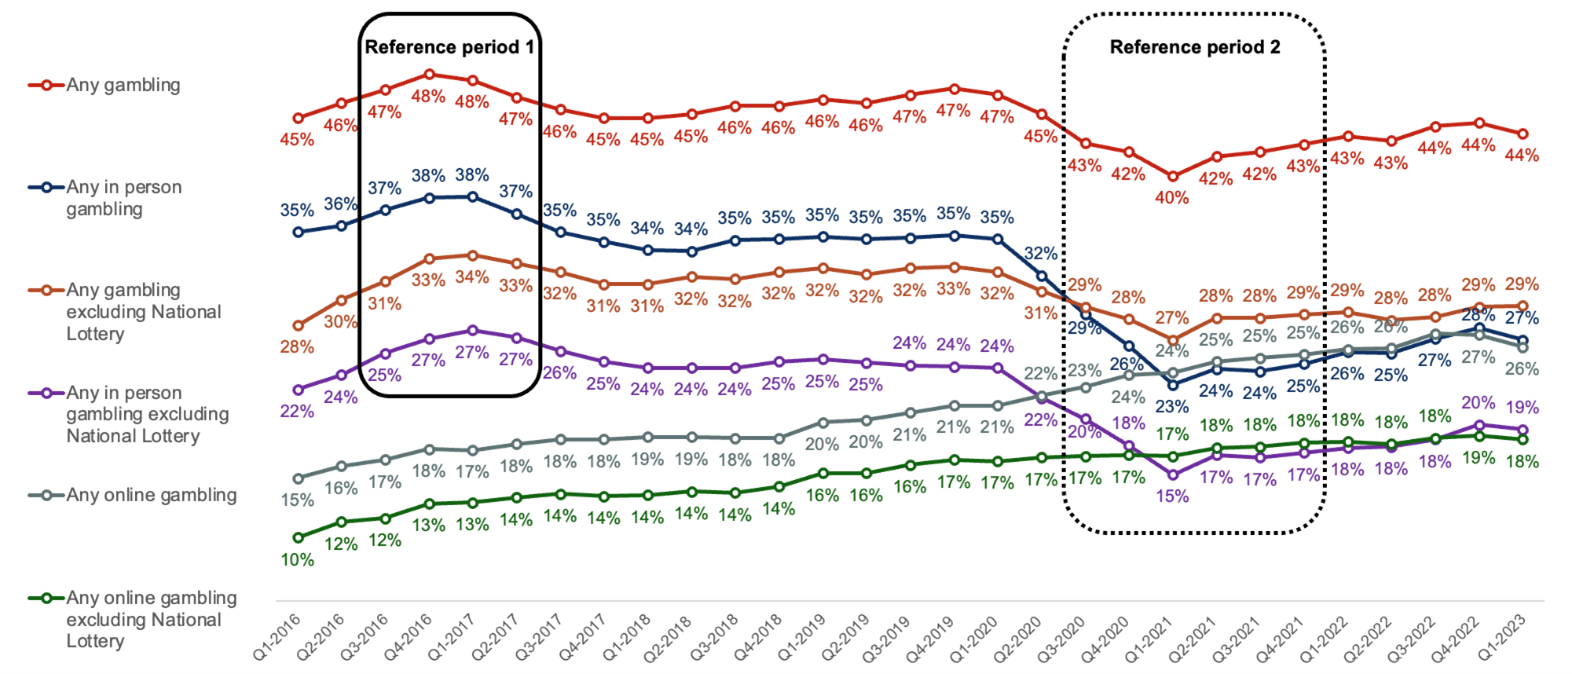
Figure 1 information
Question 1a: "I’m going to read out a list of activities. Please tell me whether you have spent any money on each one in the past four weeks, that is since [text fill date four weeks ago]." Base: All respondents each quarter (4000 to 4021 respondents) Note: Reference period 1 highlights a period with notable significant increases in participation rates, while reference period 2 highlights a period with significant decreases. These periods are represented in the following data table.
| Quarter (Q) | Any gambling | Any gambling excluding those who only play National Lottery draws | Any in person gambling | Any in person gambling excluding those who only play National Lottery draws | Any online gambling | Any online gambling excluding those who only play National Lottery draws |
|---|---|---|---|---|---|---|
| Q1 2016 | 45% | 28% | 35% | 22% | 15% | 10% |
| Q2 2016 | 46% | 30% | 36% | 24% | 16% | 12% |
| Q3 2016 | 47% | 31% | 37% | 25% | 17% | 12% |
| Q4 2016 | 48% | 33% | 38% | 27% | 18% | 13% |
| Q1 2017 | 48% | 34% | 38% | 27% | 17% | 13% |
| Q2 2017 | 47% | 33% | 37% | 27% | 18% | 14% |
| Q3 2017 | 46% | 32% | 35% | 26% | 18% | 14% |
| Q4 2017 | 45% | 31% | 35% | 25% | 18% | 14% |
| Q1 2018 | 45% | 31% | 34% | 24% | 19% | 14% |
| Q2 2018 | 45% | 32% | 34% | 24% | 19% | 14% |
| Q3 2018 | 46% | 32% | 35% | 24% | 18% | 14% |
| Q4 2018 | 46% | 32% | 35% | 25% | 18% | 14% |
| Q1 2019 | 46% | 32% | 35% | 25% | 20% | 16% |
| Q2 2019 | 46% | 32% | 35% | 25% | 20% | 16% |
| Q3 2019 | 47% | 32% | 35% | 24% | 21% | 16% |
| Q4 2019 | 47% | 33% | 35% | 24% | 21% | 17% |
| Q1 2020 | 47% | 32% | 35% | 24% | 21% | 17% |
| Q2 2020 | 45% | 31% | 32% | 22% | 22% | 17% |
| Q3 2020 | 43% | 29% | 29% | 20% | 23% | 17% |
| Q4 2020 | 42% | 28% | 26% | 18% | 24% | 17% |
| Q1 2021 | 40% | 27% | 23% | 15% | 24% | 17% |
| Q2 2021 | 42% | 28% | 24% | 17% | 25% | 18% |
| Q3 2021 | 42% | 28% | 24% | 17% | 25% | 18% |
| Q4 2021 | 43% | 29% | 25% | 17% | 25% | 18% |
| Q1 2022 | 43% | 29% | 26% | 18% | 26% | 18% |
| Q2 2022 | 43% | 28% | 25% | 18% | 26% | 18% |
| Q3 2022 | 44% | 28% | 27% | 18% | 27% | 18% |
| Q4 2022 | 44% | 29% | 28% | 20% | 27% | 19% |
| Q1 2023 | 44% | 29% | 27% | 19% | 26% | 18% |
Participation in any gambling
Participation in any gambling activity averaged 45 percent over the whole tracking period of 2015 to 2023. Participation across all forms of gambling apart from online gambling was significantly higher than the average from Quarter 3 2016 to Quarter 2 2017, as shown in Reference period 1 in Figure 1. The average for any gambling over 2016 was significantly higher at 48 percent.
Participation was significantly lower than average in 2020 and 2021 as shown in Reference period 2 in Figure 1. From Quarter 3 2020 to Quarter 4 2021 participation was statistically lower for all forms of gambling apart from online gambling. Average participation in any gambling in 2020 was 42 percent and in 2021 it was 43 percent.
Participation in any gambling began to decline following the Covid-19 outbreak in 2020 with this trend continuing until the beginning of 2021. Half of all respondents reported participating in Quarter 1 2020 (47 percent), decreasing to a low of 40 percent in Quarter 1 2021. Since 2021 overall gambling rates are showing some signs of recovery.
Men were more likely than women to have gambled (48 percent versus 42 percent). While women’s participation was relatively stable over the tracking period, it was men’s behaviour that contributed most to the peaks and troughs within the data. Prominent peaks were seen in Quarter 1 to Q4 2016 around the time of the UEFA Euros 2016 (53 percent participation), with a low from Quarter 2 2020 to Quarter 1 2021 in line with the peak Covid-19 restrictions (42 percent participation).
Overall gambling participation varies significantly by age group, with those aged 16 to 24 least likely to have gambled over the tracking period (35 percent), and those aged 45 to 54 (51 percent) or 55 to 64 (50 percent) the most likely to have participated.
The decrease in participation in 2020 was predominantly driven by a decline of in-person participation during the Covid-19 pandemic and a notable decrease in the proportion of those aged 65 or over gambling. Participation for this age group decreased from a high of 48 percent in 2016 and an average of 43 percent across the 2015 to 2023 period, to 39 percent across 2020 at the peak of the Covid-19 pandemic.
The peak in participation in 2016 around the UEFA Euros was driven by increased participation among those aged 25 to 34 and 35 to 44, alongside those aged 65 and over.
Participation in any gambling (excluding National Lottery draws)
When excluding the National Lottery only players from participation rates, the average gambling rate across the tracking period decreases to 30 percent. A similar downwards trend in participation is seen during the Covid-19 pandemic, with rates decreasing from 32 percent in Quarter 1 2020 to 27 percent in Quarter 1 2021. Gambling participation, when excluding National Lottery only players, has since shown signs of recovery, standing at 29 percent in Quarter 1 2023.
Men were more likely than women to have gambled over the period (33 percent compared to 28 percent), with the downwards trend again largely driven by changes to male participation.
When excluding National Lottery participation from figures the younger age groups become the most likely to have gambled. Around a third of those aged 16 to 24 and 25 to 34 have participated over the period (32 percent and 35 percent respectively), compared to a quarter of those aged 65 and over (26 percent).
Participation in in-person gambling
The decline in overall participation at the outbreak of the Covid-19 pandemic was driven by a decrease in the amount of in-person gambling. Participation rates across the entire tracking period were 32 percent on average, reaching a low of 23 percent in Q1 2021 down from 35 percent a year earlier. Rates of in-person gambling still remain lower than pre-pandemic levels, although they continue to slowly increase.
In-person gambling participation across the tracking period was highest among older age groups; 35 percent of those aged 55 to 64, 34 percent of 45 to 54 and 33 percent of those aged 65 and over. Participation was significantly lower among those aged 16 to 24 (25 percent). All age groups saw a significant decrease in in-person participation during 2020, particularly those aged 16 to 24 (15 percent participation) and 65 and over (26 percent participation).
Men are slightly more likely to have gambled in person than women (33 percent versus 30 percent) and saw a more marked decline in participation during 2020 and 2021 – down to 27 percent and 24 percent respectively.
Participation in in-person gambling (excluding National Lottery draws)
When excluding National Lottery participation, in-person gambling rates stand at 22 percent over the tracking period. There was a marked decline in participation again from Quarter 1 2020 (24 percent) to Quarter 1 2021 (15 percent). Participation has increased since, although is still behind where it was before the pandemic.
Men are slightly more likely to have participated in this form of gambling than women (23 percent versus 21 percent), but changes to the behaviour of both genders contributed to the decline in participation across the period.
When excluding National Lottery participation from in-person figures, rates become more similar across age groups. Around a quarter of those aged 16 to 24 and 25 to 34 have participated over the period (23 percent and 25 percent respectively), compared to a fifth of those aged 35 to 44 (22 percent), 45 to 54 (21 percent), 55 to 64 (21 percent) and 65 and over (20 percent). Those aged 16 to 24, 25 to 34, 55 to 64 and 65 and over saw the most significant decreases in participation during 2020.
Participation in any online gambling
Despite declines in overall gambling participation and in-person gambling, online gambling participation continued an upward trajectory across the tracking period. Participation in online activities started at 15 percent for Quarter 1 2016 and now stands at 26 percent for Quarter 1 2023. While the outbreak of the Covid-19 pandemic had a negative impact on in-person gambling rates, online gambling rates have continued their steady growth.
Men are more likely to gamble online than women (24 percent versus 18 percent), with an upwards trajectory for online gambling seen across genders. Men began the tracking period with online participation at 18 percent, increasing each quarter to 30 percent participation at the end of 2022. In a similar trend, women began at 12 percent online participation, increasing to 25 percent by the beginning of 2023.
Online participation rates across the tracking period were similar across those aged 25 to 34 (23 percent), 35 to 44 (26 percent), 45 to 54 (26 percent) and 55 to 64 (23 percent). Participation was lower among the oldest and youngest age groups (14 percent of those aged 65 and over, 15 percent of those aged 16 to 24). All age groups have seen an increase in participation across the period, with the increase not attributed to one particular demographic.
Participation in online gambling (excluding National Lottery draws)
Participation in online gambling averaged 15 percent across the period when excluding National Lottery draws. This form of gambling has also seen an increase in participation since tracking began, with rates starting at 10 percent and climbing to 18 percent by Quarter 1 2023. While Lottery play saw a significant shift towards online participation during the Covid-19 pandemic, this same trend is not mirrored in the broader online gambling category, which saw less notable increases during 2020 to 2021.
Men are more likely to participate in this form of gambling than women (18 percent compared to 13 percent), but both have seen a significant increase in participation over the tracking period.
Those aged 65 and over have the lowest participation rate over the period (10 percent), while most other age groups see participation of around a fifth (19 percent for those aged 25 to 34, 18 percent for 35 to 44, 17 percent for 45 to 54). The overall increases in participation across the period are driven largely by the older age groups, while levels of participation among younger people have remained more stable. Those aged 55 to 64 saw participation increase from 7 percent to 21 percent over the period, while those aged 65 and over saw an increase from 5 percent to 15 percent. This trend is perhaps reflective of a broader shift towards digital inclusion among older age groups.
Previous pageGambling Behaviour 2015 to 2023: Methodology Next page
Gambling Behaviour 2015 to 2023: Lottery participation
Last updated: 11 May 2023
Show updates to this content
No changes to show.