- Print the full document
- Save the page as a HTML document to your device
- Save the page as a PDF file
- Bookmark it - it will always be the latest version of this document
This box is not visible in the printed version.
Gambling Behaviour 2015 to 2023: Quarterly telephone survey trends
Trends in gambling behaviour from 2015 to 2018 based on data from the Gambling Commission's quarterly telephone survey.
Published: 11 May 2023
Last updated: 11 May 2023
This version was printed or saved on: 24 June 2026
Online version: https://www.gamblingcommission.gov.uk/about-us/guide/gambling-behaviour-2015-to-2023-quarterly-telephone-survey-trends
Review of gambling behaviours, 2015 to 2023
The quarterly telephone tracker was conducted by Yonder Consulting on behalf of the Gambling Commission from March 2015 to the final survey in March 2023. This report looks to review the results of the last 8 years, exploring overall key trends found in gambling participation, behaviour and attitudes across that period. During this time gambling has seen various changes that may provide context to the survey results.
-
March 2015
Beginning of the quarterly telephone tracker.
-
October 2015
National Lottery Lotto increase number of balls to 59.
-
January 2018
EuroMillions HotPicks launched.
-
November 2018
Changes to National Lottery Lotto draw rules and discontinuation of Lotto Millionaire raffle.
-
August 2019
Industry agreed voluntary ban on advertising betting during televised live sport before the watershed.
-
March 2019
National Lottery Set for Life launches.
-
April 2019
Fixed Odds Betting Terminal maximum stake cut to £2.
-
March 2020
First lockdown of the Covid-19 pandemic.
-
October 2020
Safeguards for VIP schemes came into effect.
-
May 2021
All gambling operators open by May 2021 following pandemic lockdown restrictions.
-
October 2021
Gambling Commission enhanced protections on online slot games came into effect.
-
September 2022
Gambling Commission rules for protecting at risk customers came into effect.
-
March 2023
Final fieldwork period for the quarterly telephone tracker.
Methodology
Yonder Consulting ran a telephone survey each quarter from March 2015 through to March 2023. All fieldwork was conducted by the Yonder Data Solutions team. Fieldwork for each year was the full months of March, June, September and December to capture behaviour across a month. A random digital dial methodology was used, with a quota applied which required a balance of half to be interviewed on mobile phones and half on landlines to reflect the increasing use of mobile phones and decreasing use of landlines.
Each quarter a sample of 1,000 nationally representative of British adults aged 16 years and older was surveyed. Throughout the life of the project a total of 32,047 survey interviews were conducted. Demographic quotas of age, gender, region, social grade, taken a foreign holiday in the last 3 years, tenure, number of cars in the household and working status were used to ensure a nationally representative sample was achieved. Post-fieldwork weighting was applied to bring the sample into line with the population and data processing was conducted using Quantum.1
The purpose of the quarterly surveys was to track key trends including participation, mode of play, frequency of play, motivations and problem gambling.
Results in this report are displayed as rolling quarters. For example, Quarter 1 – March 2022 is based on June 2021, September 2021, December 2021 and March 2022 and then Quarter 2 June 2022 is based on September 2021, December 2021, March 2022 and June 2022.
Reporting of statistically significant trends (at 95 percent confidence) may be limited by small base sizes.
In the report we highlight significant differences to the average across the entire tracking period. A filled circle is used on charts next to data that is significantly higher than the average across the tracking period. A triangle outline is used on charts next to data that is significantly lower than the average across the tracking period. This information will also be included in the tables that contain the data represented in the chart.
Notes
1 Quantum is a software package and programming language for statistical survey data validation, manipulation and tabulation outputs.
Gambling participation over time
Figure 1: Percent who have spent any money on gambling activities in the past 4 weeks
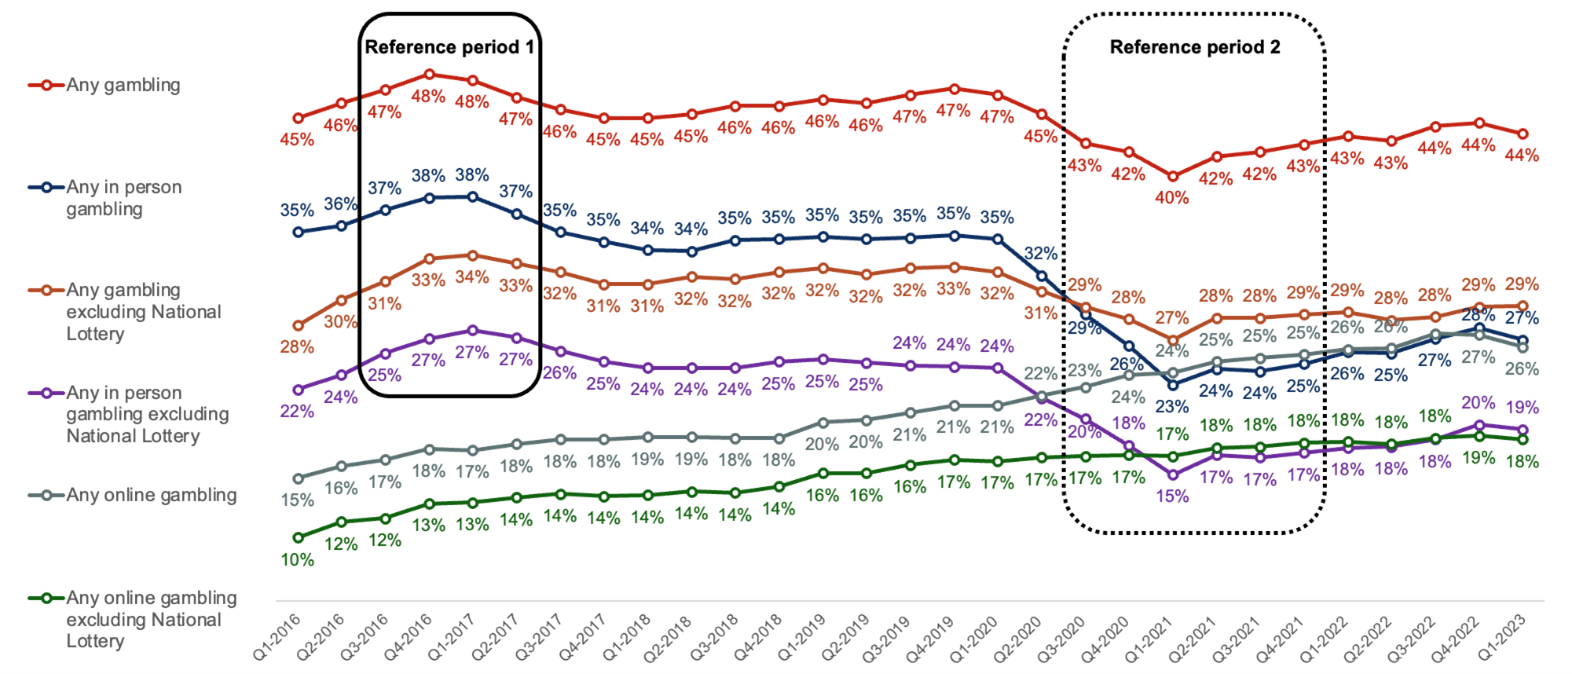
Figure 1 information
Question 1a: "I’m going to read out a list of activities. Please tell me whether you have spent any money on each one in the past four weeks, that is since [text fill date four weeks ago]." Base: All respondents each quarter (4000 to 4021 respondents) Note: Reference period 1 highlights a period with notable significant increases in participation rates, while reference period 2 highlights a period with significant decreases. These periods are represented in the following data table.
| Quarter (Q) | Any gambling | Any gambling excluding those who only play National Lottery draws | Any in person gambling | Any in person gambling excluding those who only play National Lottery draws | Any online gambling | Any online gambling excluding those who only play National Lottery draws |
|---|---|---|---|---|---|---|
| Q1 2016 | 45% | 28% | 35% | 22% | 15% | 10% |
| Q2 2016 | 46% | 30% | 36% | 24% | 16% | 12% |
| Q3 2016 | 47% | 31% | 37% | 25% | 17% | 12% |
| Q4 2016 | 48% | 33% | 38% | 27% | 18% | 13% |
| Q1 2017 | 48% | 34% | 38% | 27% | 17% | 13% |
| Q2 2017 | 47% | 33% | 37% | 27% | 18% | 14% |
| Q3 2017 | 46% | 32% | 35% | 26% | 18% | 14% |
| Q4 2017 | 45% | 31% | 35% | 25% | 18% | 14% |
| Q1 2018 | 45% | 31% | 34% | 24% | 19% | 14% |
| Q2 2018 | 45% | 32% | 34% | 24% | 19% | 14% |
| Q3 2018 | 46% | 32% | 35% | 24% | 18% | 14% |
| Q4 2018 | 46% | 32% | 35% | 25% | 18% | 14% |
| Q1 2019 | 46% | 32% | 35% | 25% | 20% | 16% |
| Q2 2019 | 46% | 32% | 35% | 25% | 20% | 16% |
| Q3 2019 | 47% | 32% | 35% | 24% | 21% | 16% |
| Q4 2019 | 47% | 33% | 35% | 24% | 21% | 17% |
| Q1 2020 | 47% | 32% | 35% | 24% | 21% | 17% |
| Q2 2020 | 45% | 31% | 32% | 22% | 22% | 17% |
| Q3 2020 | 43% | 29% | 29% | 20% | 23% | 17% |
| Q4 2020 | 42% | 28% | 26% | 18% | 24% | 17% |
| Q1 2021 | 40% | 27% | 23% | 15% | 24% | 17% |
| Q2 2021 | 42% | 28% | 24% | 17% | 25% | 18% |
| Q3 2021 | 42% | 28% | 24% | 17% | 25% | 18% |
| Q4 2021 | 43% | 29% | 25% | 17% | 25% | 18% |
| Q1 2022 | 43% | 29% | 26% | 18% | 26% | 18% |
| Q2 2022 | 43% | 28% | 25% | 18% | 26% | 18% |
| Q3 2022 | 44% | 28% | 27% | 18% | 27% | 18% |
| Q4 2022 | 44% | 29% | 28% | 20% | 27% | 19% |
| Q1 2023 | 44% | 29% | 27% | 19% | 26% | 18% |
Participation in any gambling
Participation in any gambling activity averaged 45 percent over the whole tracking period of 2015 to 2023. Participation across all forms of gambling apart from online gambling was significantly higher than the average from Quarter 3 2016 to Quarter 2 2017, as shown in Reference period 1 in Figure 1. The average for any gambling over 2016 was significantly higher at 48 percent.
Participation was significantly lower than average in 2020 and 2021 as shown in Reference period 2 in Figure 1. From Quarter 3 2020 to Quarter 4 2021 participation was statistically lower for all forms of gambling apart from online gambling. Average participation in any gambling in 2020 was 42 percent and in 2021 it was 43 percent.
Participation in any gambling began to decline following the Covid-19 outbreak in 2020 with this trend continuing until the beginning of 2021. Half of all respondents reported participating in Quarter 1 2020 (47 percent), decreasing to a low of 40 percent in Quarter 1 2021. Since 2021 overall gambling rates are showing some signs of recovery.
Men were more likely than women to have gambled (48 percent versus 42 percent). While women’s participation was relatively stable over the tracking period, it was men’s behaviour that contributed most to the peaks and troughs within the data. Prominent peaks were seen in Quarter 1 to Q4 2016 around the time of the UEFA Euros 2016 (53 percent participation), with a low from Quarter 2 2020 to Quarter 1 2021 in line with the peak Covid-19 restrictions (42 percent participation).
Overall gambling participation varies significantly by age group, with those aged 16 to 24 least likely to have gambled over the tracking period (35 percent), and those aged 45 to 54 (51 percent) or 55 to 64 (50 percent) the most likely to have participated.
The decrease in participation in 2020 was predominantly driven by a decline of in-person participation during the Covid-19 pandemic and a notable decrease in the proportion of those aged 65 or over gambling. Participation for this age group decreased from a high of 48 percent in 2016 and an average of 43 percent across the 2015 to 2023 period, to 39 percent across 2020 at the peak of the Covid-19 pandemic.
The peak in participation in 2016 around the UEFA Euros was driven by increased participation among those aged 25 to 34 and 35 to 44, alongside those aged 65 and over.
Participation in any gambling (excluding National Lottery draws)
When excluding the National Lottery only players from participation rates, the average gambling rate across the tracking period decreases to 30 percent. A similar downwards trend in participation is seen during the Covid-19 pandemic, with rates decreasing from 32 percent in Quarter 1 2020 to 27 percent in Quarter 1 2021. Gambling participation, when excluding National Lottery only players, has since shown signs of recovery, standing at 29 percent in Quarter 1 2023.
Men were more likely than women to have gambled over the period (33 percent compared to 28 percent), with the downwards trend again largely driven by changes to male participation.
When excluding National Lottery participation from figures the younger age groups become the most likely to have gambled. Around a third of those aged 16 to 24 and 25 to 34 have participated over the period (32 percent and 35 percent respectively), compared to a quarter of those aged 65 and over (26 percent).
Participation in in-person gambling
The decline in overall participation at the outbreak of the Covid-19 pandemic was driven by a decrease in the amount of in-person gambling. Participation rates across the entire tracking period were 32 percent on average, reaching a low of 23 percent in Q1 2021 down from 35 percent a year earlier. Rates of in-person gambling still remain lower than pre-pandemic levels, although they continue to slowly increase.
In-person gambling participation across the tracking period was highest among older age groups; 35 percent of those aged 55 to 64, 34 percent of 45 to 54 and 33 percent of those aged 65 and over. Participation was significantly lower among those aged 16 to 24 (25 percent). All age groups saw a significant decrease in in-person participation during 2020, particularly those aged 16 to 24 (15 percent participation) and 65 and over (26 percent participation).
Men are slightly more likely to have gambled in person than women (33 percent versus 30 percent) and saw a more marked decline in participation during 2020 and 2021 – down to 27 percent and 24 percent respectively.
Participation in in-person gambling (excluding National Lottery draws)
When excluding National Lottery participation, in-person gambling rates stand at 22 percent over the tracking period. There was a marked decline in participation again from Quarter 1 2020 (24 percent) to Quarter 1 2021 (15 percent). Participation has increased since, although is still behind where it was before the pandemic.
Men are slightly more likely to have participated in this form of gambling than women (23 percent versus 21 percent), but changes to the behaviour of both genders contributed to the decline in participation across the period.
When excluding National Lottery participation from in-person figures, rates become more similar across age groups. Around a quarter of those aged 16 to 24 and 25 to 34 have participated over the period (23 percent and 25 percent respectively), compared to a fifth of those aged 35 to 44 (22 percent), 45 to 54 (21 percent), 55 to 64 (21 percent) and 65 and over (20 percent). Those aged 16 to 24, 25 to 34, 55 to 64 and 65 and over saw the most significant decreases in participation during 2020.
Participation in any online gambling
Despite declines in overall gambling participation and in-person gambling, online gambling participation continued an upward trajectory across the tracking period. Participation in online activities started at 15 percent for Quarter 1 2016 and now stands at 26 percent for Quarter 1 2023. While the outbreak of the Covid-19 pandemic had a negative impact on in-person gambling rates, online gambling rates have continued their steady growth.
Men are more likely to gamble online than women (24 percent versus 18 percent), with an upwards trajectory for online gambling seen across genders. Men began the tracking period with online participation at 18 percent, increasing each quarter to 30 percent participation at the end of 2022. In a similar trend, women began at 12 percent online participation, increasing to 25 percent by the beginning of 2023.
Online participation rates across the tracking period were similar across those aged 25 to 34 (23 percent), 35 to 44 (26 percent), 45 to 54 (26 percent) and 55 to 64 (23 percent). Participation was lower among the oldest and youngest age groups (14 percent of those aged 65 and over, 15 percent of those aged 16 to 24). All age groups have seen an increase in participation across the period, with the increase not attributed to one particular demographic.
Participation in online gambling (excluding National Lottery draws)
Participation in online gambling averaged 15 percent across the period when excluding National Lottery draws. This form of gambling has also seen an increase in participation since tracking began, with rates starting at 10 percent and climbing to 18 percent by Quarter 1 2023. While Lottery play saw a significant shift towards online participation during the Covid-19 pandemic, this same trend is not mirrored in the broader online gambling category, which saw less notable increases during 2020 to 2021.
Men are more likely to participate in this form of gambling than women (18 percent compared to 13 percent), but both have seen a significant increase in participation over the tracking period.
Those aged 65 and over have the lowest participation rate over the period (10 percent), while most other age groups see participation of around a fifth (19 percent for those aged 25 to 34, 18 percent for 35 to 44, 17 percent for 45 to 54). The overall increases in participation across the period are driven largely by the older age groups, while levels of participation among younger people have remained more stable. Those aged 55 to 64 saw participation increase from 7 percent to 21 percent over the period, while those aged 65 and over saw an increase from 5 percent to 15 percent. This trend is perhaps reflective of a broader shift towards digital inclusion among older age groups.
Lottery participation
Lottery participation
This includes purchased tickets for the National Lottery draws (Lotto, Euromillions, Thunderball, Set for Life, Hotpicks), a charity lottery or other lottery in the past four weeks.
Figure 2: Percent who have spent money on any Lottery participation in the past 4 weeks
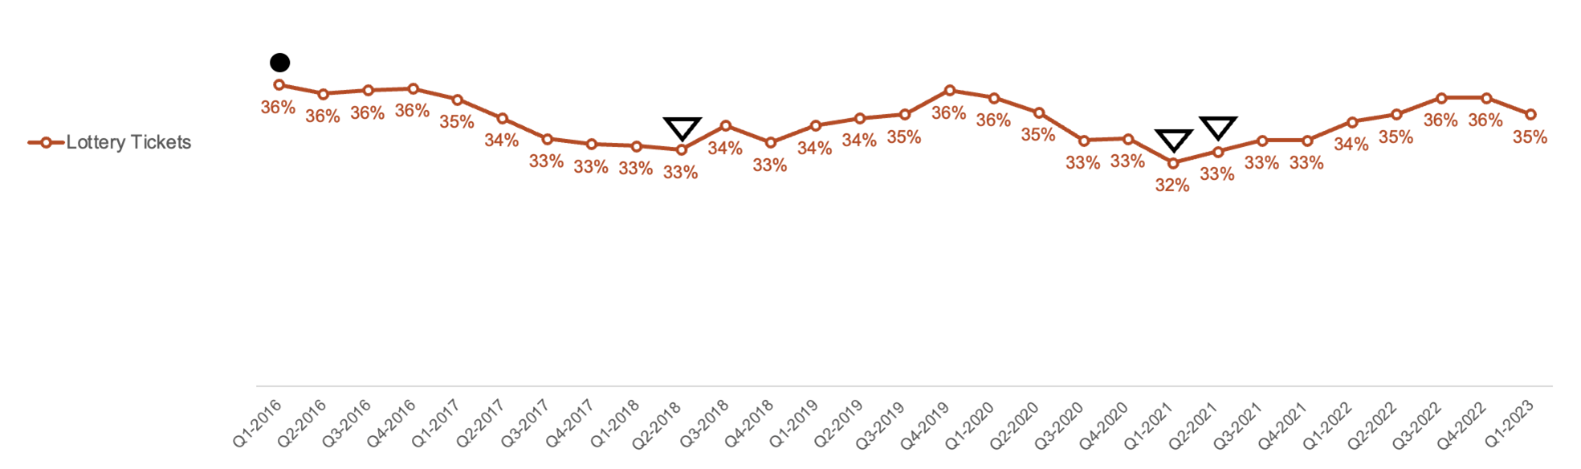
Figure 2 information
Question 1a: "I’m going to read out a list of activities. Please tell me whether you have spent any money on each one in the past four weeks, that is since [text fill date four weeks ago]." Base: All respondents each quarter (4000 to 4021 respondents) A filled circle is used next to data that is significantly higher than the average across the tracking period. A triangle outline is used next to data that is significantly lower than the average across the tracking period. This data is represented in the following data table.
| Quarter (Q) | Purchased any Lottery Tickets in the last 4 weeks (including National Lottery, a charity lottery or another lottery) (percentage) | Difference between the reporting period and the average across the entire tracking period |
|---|---|---|
| Q1 2016 | 36% | Significant increase |
| Q2 2016 | 36% | No significant difference |
| Q3 2016 | 36% | No significant difference |
| Q4 2016 | 36% | No significant difference |
| Q1 2017 | 35% | No significant difference |
| Q2 2017 | 34% | No significant difference |
| Q3 2017 | 33% | No significant difference |
| Q4 2017 | 33% | No significant difference |
| Q1 2018 | 33% | No significant difference |
| Q2 2018 | 33% | Significant decrease |
| Q3 2018 | 34% | No significant difference |
| Q4 2018 | 33% | No significant difference |
| Q1 2019 | 34% | No significant difference |
| Q2 2019 | 34% | No significant difference |
| Q3 2019 | 35% | No significant difference |
| Q4 2019 | 36% | No significant difference |
| Q1 2020 | 36% | No significant difference |
| Q2 2020 | 35% | No significant difference |
| Q3 2020 | 33% | No significant difference |
| Q4 2020 | 33% | No significant difference |
| Q1 2021 | 32% | Significant decrease |
| Q2 2021 | 33% | Significant decrease |
| Q3 2021 | 33% | No significant difference |
| Q4 2021 | 33% | No significant difference |
| Q1 2022 | 34% | No significant difference |
| Q2 2022 | 35% | No significant difference |
| Q3 2022 | 36% | No significant difference |
| Q4 2022 | 36% | No significant difference |
| Q1 2023 | 35% | No significant difference |
Lottery participation averaged 34 percent over the tracking period. Participation remained relatively consistent over the period, with the only significant increase of 36 percent in Quarter 1 2016. A slight downwards trend was seen with the outbreak of Covid-19 cumulating with a low of 32 percent participation in Quarter 1 2021.
Participation rates were relatively similar by gender across the period, with 35 percent of men and 34 percent of women purchasing lottery tickets. Women’s participation remained stable during the Covid-19 period, with men predominantly driving the overall decreases seen in 2020 and beginning of 2021.
Lottery participation differs by age group, with only 12 percent of 16 to 24 year olds having purchased a ticket across the tracking period, compared to 44 percent of those aged 45 to 54 and 55 to 64. Those aged 25 to 34 and those aged 65 and over drove the significant decrease in participation seen in Quarter 1 and Quarter 2 2021, with participation among other age groups remaining more stable.
Figure 3: Percent who have spent money on Lottery participation in person and/or online in the last 4 weeks
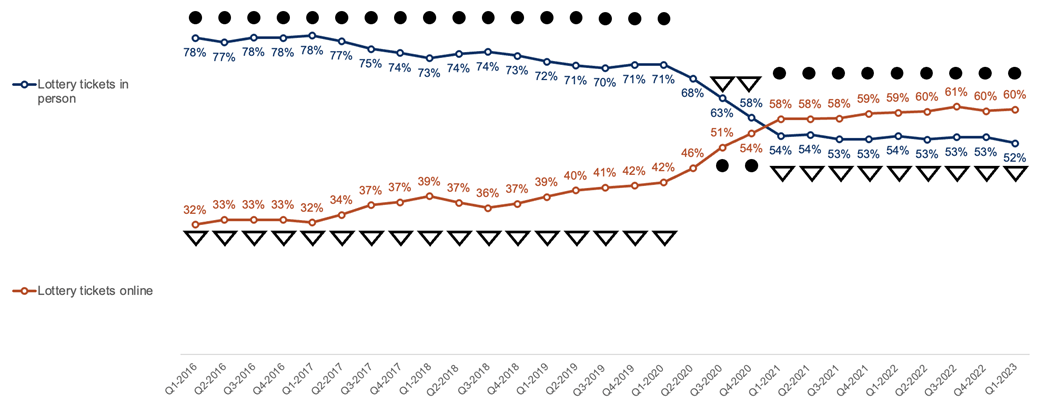
Figure 3 information
Question 2: "And, in the last 4 weeks, did you spend money on [insert answer at Q1a] in person, online or both?" Base: All respondents who had bought lottery tickets each quarter (1300 to 1471 respondents) A filled circle is used next to data that is significantly higher than the average across the tracking period. A triangle outline is used next to data that is significantly lower than the average across the tracking period. This data is represented in the following data table. Note: figures for each wave do not sum to 100 percent due to some respondents purchasing tickets both online and in-person.
| Quarter (Q) | Lottery tickets in person | Difference between the reporting period and the average across the entire tracking period | Lottery tickets online | Difference between the reporting period and the average across the entire tracking period |
|---|---|---|---|---|
| Q1 2016 | 78% | Significant increase | 32% | Significant decrease |
| Q2 2016 | 77% | Significant increase | 33% | Significant decrease |
| Q3 2016 | 78% | Significant increase | 33% | Significant decrease |
| Q4 2016 | 78% | Significant increase | 33% | Significant decrease |
| Q1 2017 | 78% | Significant increase | 32% | Significant decrease |
| Q2 2017 | 77% | Significant increase | 34% | Significant decrease |
| Q3 2017 | 75% | Significant increase | 37% | Significant decrease |
| Q4 2017 | 74% | Significant increase | 37% | Significant decrease |
| Q1 2018 | 73% | Significant increase | 39% | Significant decrease |
| Q2 2018 | 74% | Significant increase | 37% | Significant decrease |
| Q3 2018 | 74% | Significant increase | 36% | Significant decrease |
| Q4 2018 | 73% | Significant increase | 37% | Significant decrease |
| Q1 2019 | 72% | Significant increase | 39% | Significant decrease |
| Q2 2019 | 71% | Significant increase | 40% | Significant decrease |
| Q3 2019 | 70% | Significant increase | 41% | Significant decrease |
| Q4 2019 | 71% | Significant increase | 42% | Significant decrease |
| Q1 2020 | 71% | Significant increase | 42% | Significant decrease |
| Q2 2020 | 68% | No significant difference | 46% | No significant difference |
| Q3 2020 | 63% | Significant decrease | 51% | Significant increase |
| Q4 2020 | 58% | Significant decrease | 54% | Significant increase |
| Q1 2021 | 54% | Significant decrease | 58% | Significant increase |
| Q2 2021 | 54% | Significant decrease | 58% | Significant increase |
| Q3 2021 | 53% | Significant decrease | 58% | Significant increase |
| Q4 2021 | 53% | Significant decrease | 59% | Significant increase |
| Q1 2022 | 54% | Significant decrease | 59% | Significant increase |
| Q2 2022 | 53% | Significant decrease | 60% | Significant increase |
| Q3 2022 | 53% | Significant decrease | 61% | Significant increase |
| Q4 2022 | 53% | Significant decrease | 60% | Significant increase |
| Q1 2023 | 52% | Significant decrease | 60% | Significant increase |
There has been a switch in behaviour from in-person to online Lottery ticket purchases over the tracking period. While in-person purchases were more popular than online when tracking began, they saw a strong decline beginning in Quarter 2 2020 and continuing to Quarter 1 2021. Online became the most popular purchase method for Lottery tickets in Quarter 1 2021 and has remained the preferred method since.
Men and women were equally likely to be purchasing tickets in person (66 percent and 67 percent respectively) or online (45 percent and 45 percent respectively) across the tracking period. Both also experienced the same decrease in in person purchases driven by Covid-19, with online lottery tickets overtaking in person purchases.
Those aged 65 and over were the only age group not to have seen online replace in person as the most popular purchase method over the period.
Scratchcard, sports betting, fruit machines, slots and instant win games participation
Scratchcard participation in the past four weeks
Scratchcard purchases peaked in Quarter 1 2017 at 13 percent but have seen a decline since, culminating with a low of 7 percent in Quarter 1 2021, which has remained relatively unchanged since.
Scratchcard purchase is consistent by gender, with 9 percent of men and 10 percent of women having purchased these over the course of the tracking period. Both men and women have seen a decrease in participation since 2020 which has not returned to pre-pandemic levels.
Participation rates are highest among those aged 25 to 34 (14 percent) and 16 to 24 year olds (12 percent), while just 5 percent of those aged 65 and over have participated. The decline in participation following the pandemic has mainly been driven by decreases among the younger age groups and those aged 65 and over. Participation has remained more consistent annually among the other age groups.
Figure 4: Percent who have spent any money on selected gambling activities in the past 4 weeks
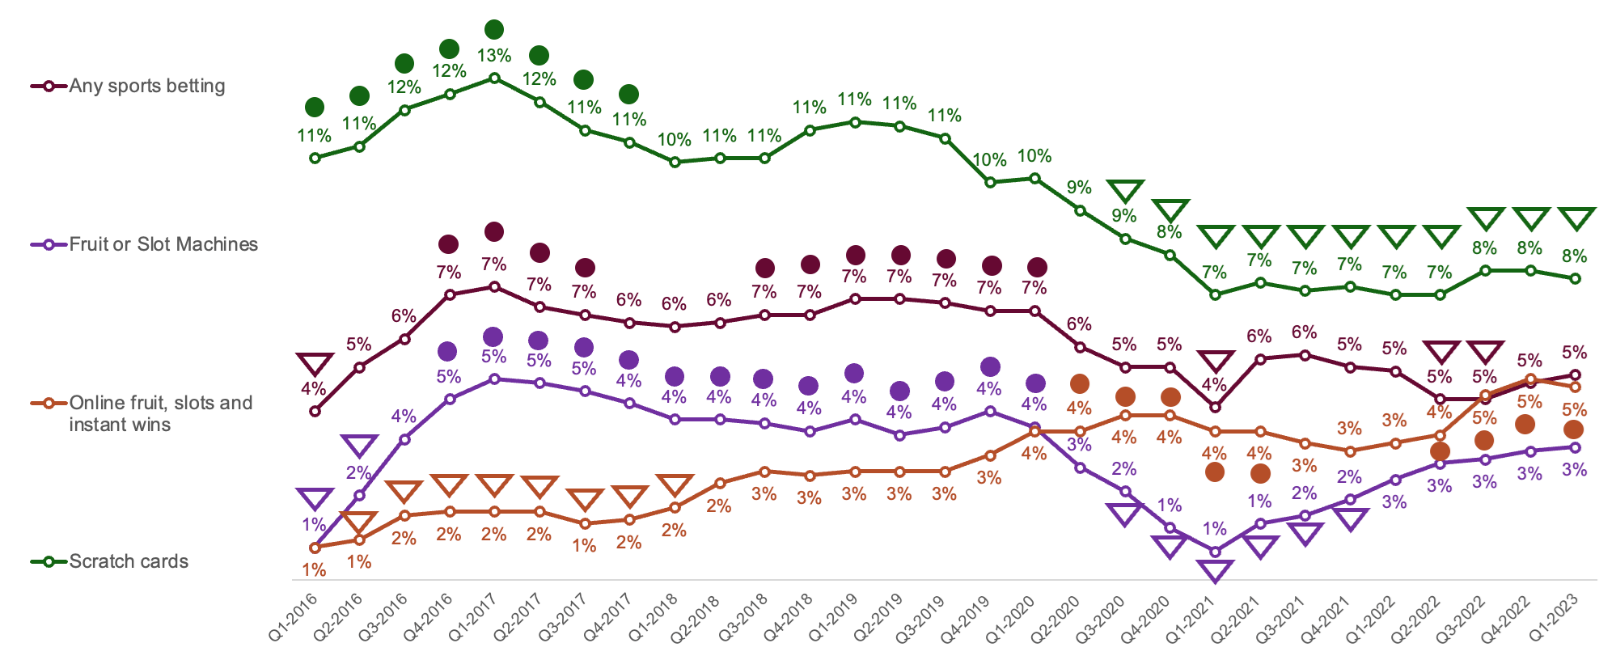
Figure 4 information
Question 1a: "I’m going to read out a list of activities. Please tell me whether you have spent any money on each one in the past four weeks, that is since [text fill date four weeks ago]." Base: All respondents each quarter (4000 to 4021 respondents) A filled circle is used next to data that is significantly higher than the average across the tracking period. A triangle outline is used next to data that is significantly lower than the average across the tracking period. This data is represented in the following data table. Note: the online fruit, slots and instant wins category was expanded from Quarter 1 2018 data to include participation in National Lottery Online Instant Wins. The Fruit or Slot Machines category was expanded from Quarter 2 2016 to include Fruit or Slot Machines at bingo halls.
| Quarter (Q) | Any Sports betting (including horses, dogs, football, tennis, other sporting events) | Difference between the reporting period and the average across the entire tracking period | Fruit or Slot Machines | Difference between the reporting period and the average across the entire tracking period | Online fruit, slots and instant wins | Difference between the reporting period and the average across the entire tracking period | Scratch cards | Difference between the reporting period and the average across the entire tracking period |
|---|---|---|---|---|---|---|---|---|
| Q1 2016 | 4% | Significant decrease | 1% | Significant decrease | 1% | Significant decrease | 11% | Significant increase |
| Q2 2016 | 5% | No significant difference | 2% | Significant decrease | 1% | Significant decrease | 11% | Significant increase |
| Q3 2016 | 6% | No significant difference | 4% | No significant difference | 2% | Significant decrease | 12% | Significant increase |
| Q4 2016 | 7% | Significant increase | 5% | Significant increase | 2% | Significant decrease | 12% | Significant increase |
| Q1 2017 | 7% | Significant increase | 5% | Significant increase | 2% | Significant decrease | 13% | Significant increase |
| Q2 2017 | 7% | Significant increase | 5% | Significant increase | 2% | Significant decrease | 12% | Significant increase |
| Q3 2017 | 7% | Significant increase | 5% | Significant increase | 1% | Significant decrease | 11% | Significant increase |
| Q4 2017 | 6% | No significant difference | 4% | Significant increase | 2% | Significant decrease | 11% | Significant increase |
| Q1 2018 | 6% | No significant difference | 4% | Significant increase | 2% | Significant decrease | 10% | No significant difference |
| Q2 2018 | 6% | No significant difference | 4% | Significant increase | 2% | No significant difference | 11% | No significant difference |
| Q3 2018 | 7% | Significant increase | 4% | Significant increase | 3% | No significant difference | 11% | No significant difference |
| Q4 2018 | 7% | Significant increase | 4% | Significant increase | 3% | No significant difference | 11% | No significant difference |
| Q1 2019 | 7% | Significant increase | 4% | Significant increase | 3% | No significant difference | 11% | No significant difference |
| Q2 2019 | 7% | Significant increase | 4% | Significant increase | 3% | No significant difference | 11% | No significant difference |
| Q3 2019 | 7% | Significant increase | 4% | Significant increase | 3% | No significant difference | 11% | No significant difference |
| Q4 2019 | 7% | Significant increase | 4% | Significant increase | 3% | No significant difference | 10% | No significant difference |
| Q1 2020 | 7% | Significant increase | 4% | Significant increase | 4% | No significant difference | 10% | No significant difference |
| Q2 2020 | 6% | No significant difference | 3% | No significant difference | 4% | Significant increase | 9% | No significant difference |
| Q3 2020 | 5% | No significant difference | 2% | Significant decrease | 4% | Significant increase | 9% | Significant decrease |
| Q4 2020 | 5% | No significant difference | 1% | Significant decrease | 4% | Significant increase | 8% | Significant decrease |
| Q1 2021 | 4% | Significant decrease | 1% | Significant decrease | 4% | Significant increase | 7% | Significant decrease |
| Q2 2021 | 6% | No significant difference | 1% | Significant decrease | 4% | Significant increase | 7% | Significant decrease |
| Q3 2021 | 6% | No significant difference | 2% | Significant decrease | 3% | No significant difference | 7% | Significant decrease |
| Q4 2021 | 5% | No significant difference | 2% | Significant decrease | 3% | No significant difference | 7% | Significant decrease |
| Q1 2022 | 5% | No significant difference | 3% | No significant difference | 3% | No significant difference | 7% | Significant decrease |
| Q2 2022 | 5% | Significant decrease | 3% | No significant difference | 4% | Significant increase | 7% | Significant decrease |
| Q3 2022 | 5% | Significant decrease | 3% | No significant difference | 5% | Significant increase | 8% | Significant decrease |
| Q4 2022 | 5% | No significant difference | 3% | No significant difference | 5% | Significant increase | 8% | Significant decrease |
| Q1 2023 | 5% | No significant difference | 3% | No significant difference | 5% | Significant increase | 8% | Significant decrease |
Sports betting participation
This includes betting on horse races, dog races, football, tennis or other sporting events in the past 4 weeks.
Participation rates for any sports betting was 6 percent over the tracking period. Similarly to gambling through other in-person methods, participation decreased during the Covid-19 period, to a statistically significant low of 4 percent in Quarter 1 2021.
Men were significantly more likely to have participated in sports betting than women over the tracking period (10 percent compared to 1 percent), with both genders experiencing a decline in participation over 2020 to early 2021.
Those aged 16 to 24 and 25 to 34 were most likely to participate in sports betting (10 percent and 11 percent), with this predominantly made up of betting on football (8 percent and 9 percent respectively). These age groups did not experience a notable decline in participation during the pandemic, remaining at an 11 percent and 9 percent average across 2020. Just 1 percent of those aged 65 and over participated in sports betting across the period.
Fruit and slot machine participation
This includes using fruit or slot machines in pubs, gaming centres and/or arcades, casinos or bingo halls, or virtual gaming machines in a bookmaker’s in the past four weeks.
3 percent used fruit and slot machines over the tracking period. Participation decreased significantly during the Covid-19 pandemic, to a low of 1 percent in Quarter 1 2021. Rates began to increase again from Quarter 2 2021, although they are still behind where they were in 2017.
Men were more likely to use fruit and slot machines than women over the period (4 percent versus 2 percent), while 16 to 24 year olds were the most likely age group to participate (8 percent). All demographic groups saw a significant decline in participation during the pandemic.
Online fruit, slots and instant wins participation
This includes using online fruit and/or slot machine style games or online instant win games and/or National Lottery Online Instant Wins in the past four weeks.
An average of 3 percent had participated in online fruit, slots and instant wins over the tracking period. This gambling category did not see the same impact as in-person activities during Covid-19, with participation generally increasing over the period. Participation reached a high of 5 percent in Quarter 1 2023, significantly higher than 1 percent when tracking began. A change to how the category was measured in the survey, with the inclusion of National Lottery instant wins in Quarter 4 2017, may have also had an impact on these participation rates.
Participation is consistent across gender, with both men and women experiencing an increase in participation across the tracking period.
Participation is highest among those aged 25 to 34 and 35 to 44, with both experiencing an average of 4 percent across the period. Those aged 65 and over are least likely to have participated in online fruit, slots and instant wins (1 percent). Nonetheless, similarly to other age groups their participation has increased over time – from less than one percent across 2015 to 2019, to 2 percent in 2022.
Perceptions of the gambling industry as fair and trusted
Figure 5: Percent who agree and/or disagree that ‘gambling is conducted fairly and can be trusted in this country’
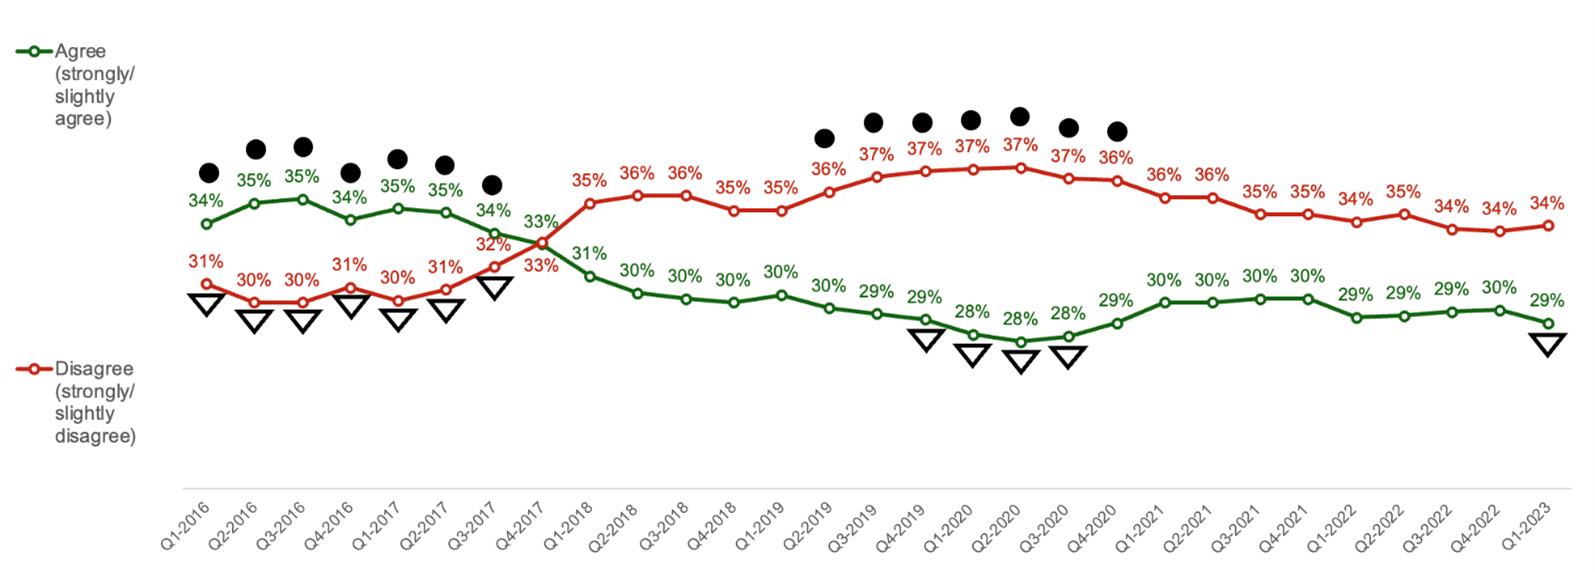
Figure 5 information
Question 11: "How far do you agree or disagree that in this country, gambling is conducted fairly and can be trusted?"
Base: All respondents each quarter (4000 to 4021 respondents)
A filled circle is used next to data that is significantly higher than the average across the tracking period. A triangle outline is used next to data that is significantly lower than the average across the tracking period. This data is represented in the following data table.
| Quarter (Q) | Agree | Difference between the reporting period and the average across the entire tracking period | Disagree | Difference between the reporting period and the average across the entire tracking period |
|---|---|---|---|---|
| Q1 2016 | 34% | Significant increase | 31% | Significant decrease |
| Q2 2016 | 35% | Significant increase | 30% | Significant decrease |
| Q3 2016 | 35% | Significant increase | 30% | Significant decrease |
| Q4 2016 | 34% | Significant increase | 31% | Significant decrease |
| Q1 2017 | 35% | Significant increase | 30% | Significant decrease |
| Q2 2017 | 35% | Significant increase | 31% | Significant decrease |
| Q3 2017 | 34% | Significant increase | 32% | Significant decrease |
| Q4 2017 | 33% | No significant difference | 33% | No significant difference |
| Q1 2018 | 31% | No significant difference | 35% | No significant difference |
| Q2 2018 | 30% | No significant difference | 36% | No significant difference |
| Q3 2018 | 30% | No significant difference | 36% | No significant difference |
| Q4 2018 | 30% | No significant difference | 35% | No significant difference |
| Q1 2019 | 30% | No significant difference | 35% | No significant difference |
| Q2 2019 | 30% | No significant difference | 36% | Significant increase |
| Q3 2019 | 29% | No significant difference | 37% | Significant increase |
| Q4 2019 | 29% | Significant decrease | 37% | Significant increase |
| Q1 2020 | 28% | Significant decrease | 37% | Significant increase |
| Q2 2020 | 28% | Significant decrease | 37% | Significant increase |
| Q3 2020 | 28% | Significant decrease | 37% | Significant increase |
| Q4 2020 | 29% | No significant difference | 36% | Significant increase |
| Q1 2021 | 30% | No significant difference | 36% | No significant difference |
| Q2 2021 | 30% | No significant difference | 36% | No significant difference |
| Q3 2021 | 30% | No significant difference | 35% | No significant difference |
| Q4 2021 | 30% | No significant difference | 35% | No significant difference |
| Q1 2022 | 29% | No significant difference | 34% | No significant difference |
| Q2 2022 | 29% | No significant difference | 35% | No significant difference |
| Q3 2022 | 29% | No significant difference | 34% | No significant difference |
| Q4 2022 | 30% | No significant difference | 34% | No significant difference |
| Q1 2023 | 29% | Significant decrease | 34% | No significant difference |
Overall agreement that gambling is conducted fairly and can be trusted in this country averaged 31 percent over the tracking period. Agreement was significantly higher than the average in 2016 (34 percent) and 2017 (33 percent), while perceptions were significantly lower than average in 2019 (29 percent). Participants were more likely to agree than disagree with this statement up until Quarter 1 2018, when the trend switched and disagreement became more widespread.
Men were significantly more likely to agree with the statement than women (36 percent versus 26 percent), while women’s attitudes were more variable over the tracking period.
Gamblers were significantly more likely to agree that gambling is conducted fairly and can be trusted than non-gamblers (39 percent versus 27 percent). Levels of agreement among non-gamblers remained relatively consistent across the period, while gamblers saw a significant peak in agreement in 2016 and 2017 (44 percent), with a low in 2019 (36 percent).
Those classified as low and moderate risk gamblers according to the Short Form Problem Gambling Severity Index are most likely to feel the sector can be fair and trusted (43 percent and 42 percent agree respectively), with levels of agreement remaining consistent over the period.
Across the tracking period as a whole, those classified as problem gamblers and non-problem gamblers are least likely to agree that the industry is fair and can be trusted (39 percent and 34 percent respectively), with close to half of problem gamblers disagreeing with the statement (49 percent). While non-problem gamblers saw a peak in agreement in 2016 and 2017 (37 percent) alongside a low of 31 percent in 2019 and 2020, low base sizes mean that trends among those classified as problem gamblers are unable to be further explored.
Incidence of problem gambling – Short Form PGSI
Figure 6: Percent classified as non-problem gamblers
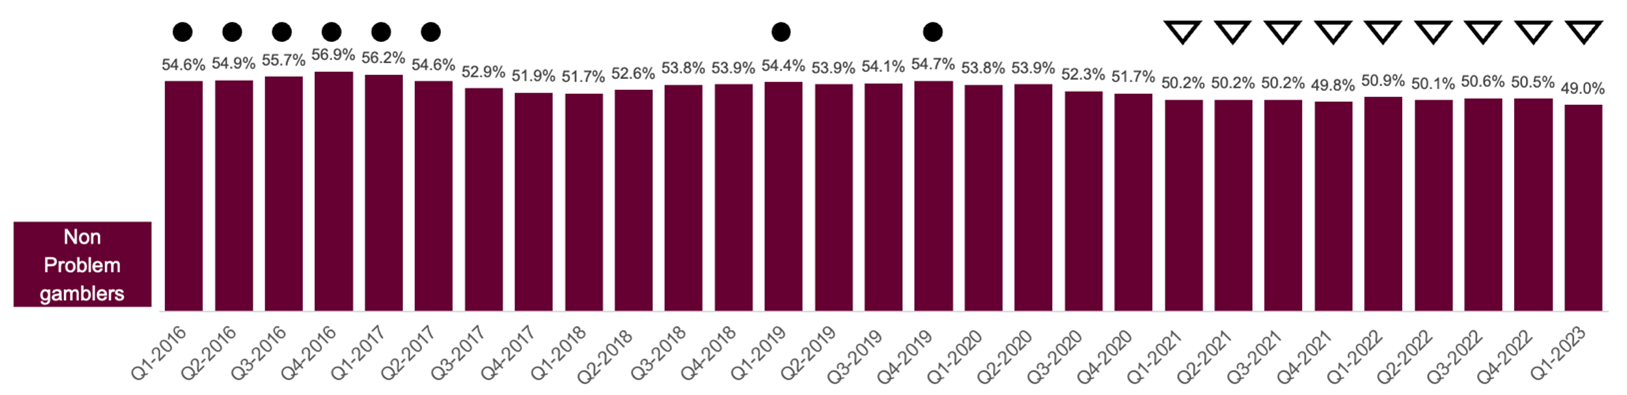
Figure 6 information
Short Form Problem Gambling Severity Index (PGSI): Percentage of respondents classified as non problem gamblers1 Base: All respondents each quarter (4000 to 4021 respondents) A filled circle is used next to data that is significantly higher than the average across the tracking period. A triangle outline is used next to data that is significantly lower than the average across the tracking period. This data is represented in the following data table.
| Quarter (Q) | Non-Problem Gamblers (Score of 0 on short-form PGSI) (percentage) | Difference between the reporting period and the average across the entire tracking period |
|---|---|---|
| Q1 2016 | 54.6% | Significant increase |
| Q2 2016 | 54.9% | Significant increase |
| Q3 2016 | 55.7% | Significant increase |
| Q4 2016 | 56.9% | Significant increase |
| Q1 2017 | 56.2% | Significant increase |
| Q2 2017 | 54.6% | Significant increase |
| Q3 2017 | 52.9% | No significant difference |
| Q4 2017 | 51.9% | No significant difference |
| Q1 2018 | 51.7% | No significant difference |
| Q2 2018 | 52.6% | No significant difference |
| Q3 2018 | 53.8% | No significant difference |
| Q4 2018 | 53.9% | No significant difference |
| Q1 2019 | 54.4% | Significant increase |
| Q2 2019 | 53.9% | No significant difference |
| Q3 2019 | 54.1% | No significant difference |
| Q4 2019 | 54.7% | Significant increase |
| Q1 2020 | 53.8% | No significant difference |
| Q2 2020 | 53.9% | No significant difference |
| Q3 2020 | 52.3% | No significant difference |
| Q4 2020 | 51.7% | No significant difference |
| Q1 2021 | 50.2% | Significant decrease |
| Q2 2021 | 50.2% | Significant decrease |
| Q3 2021 | 50.2% | Significant decrease |
| Q4 2021 | 49.8% | Significant decrease |
| Q1 2022 | 50.9% | Significant decrease |
| Q2 2022 | 50.1% | Significant decrease |
| Q3 2022 | 50.6% | Significant decrease |
| Q4 2022 | 50.5% | Significant decrease |
| Q1 2023 | 49.0% | Significant decrease |
An average of 53 percent were classified as non-problem gamblers across the 2015 to 2023 tracking period. The prevalence of non-problem gamblers was lowest in 2021 and 2022 (50 percent and 51 percent respectively), when the prevalence of non-gamblers increased. Rates were significantly higher in 2016, with 57 percent being classified as non-problem gamblers and significantly fewer non-gamblers.
Men were significantly more likely to be classed as non-problem gamblers than women (54 percent versus 52 percent), although women were more likely not to have gambled at all (45 percent versus 40 percent). Likelihood to be a non-problem gambler increases with age. Across the period, 42 percent of those aged 16 to 24 were classified as non-problem gamblers compared to 48 percent of those aged 65 and over.
Figure 7: Percent classified as problem gamblers and/or moderate risk gamblers and/or low risk gamblers
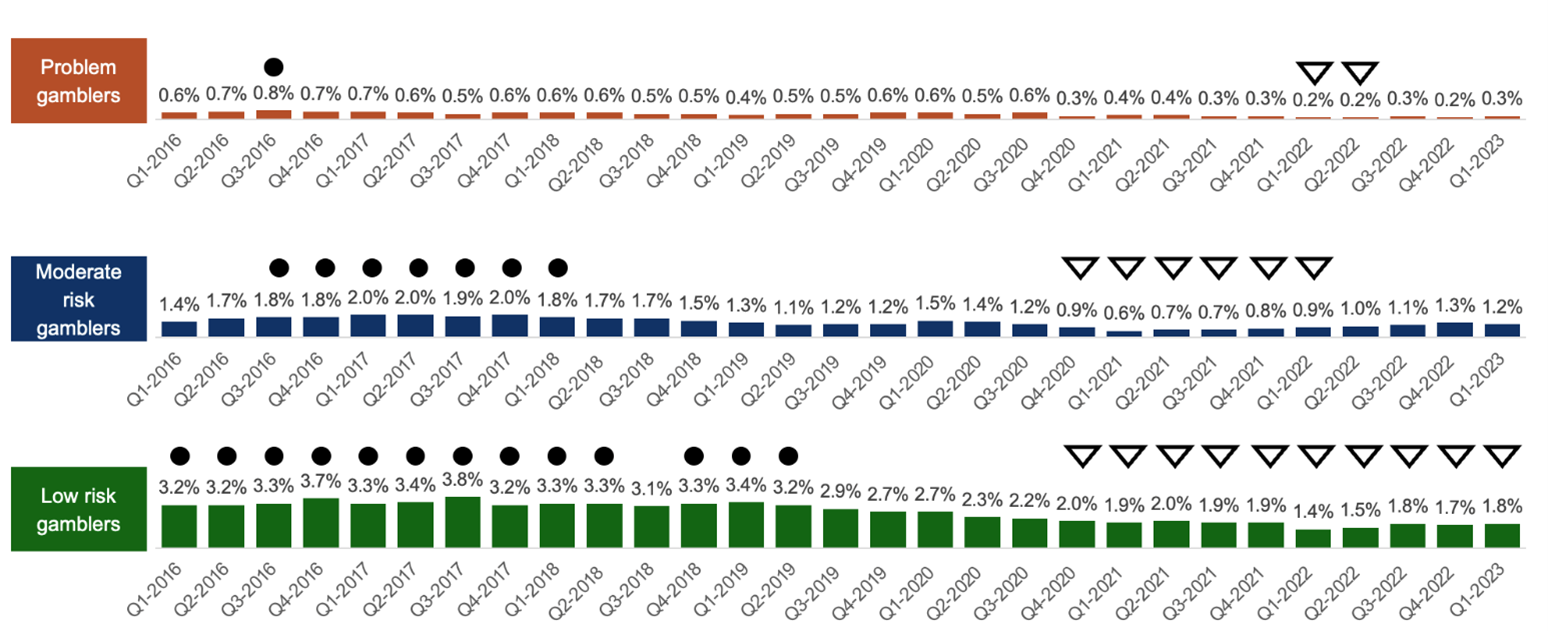
Figure 7 information
Short Form Problem Gambling Severity Index: Percentage of respondents classified as problem gamblers, moderate risk gamblers and low risk gamblers Base: All respondents each quarter (4000 to 4021 respondents) A filled circle is used next to data that is significantly higher than the average across the tracking period. A triangle outline is used next to data that is significantly lower than the average across the tracking period. This data is represented in the following data table.
| Quarter (Q) | Problem gamblers (Score of 4 or more on the short-form PGSI) | Difference between the reporting period and the average across the entire tracking period | Moderate risk gamblers (Score of 2 to 3 on the short-form PGSI) | Difference between the reporting period and the average across the entire tracking period | Low risk gamblers (Score of 1 on the short-form PGSI) | Difference between the reporting period and the average across the entire tracking period |
|---|---|---|---|---|---|---|
| Q1 2016 | 0.6% | No significant difference | 1.4% | No significant difference | 3.2% | Significant increase |
| Q2 2016 | 0.7% | No significant difference | 1.7% | No significant difference | 3.2% | Significant increase |
| Q3 2016 | 0.8% | Significant increase | 1.8% | Significant increase | 3.3% | Significant increase |
| Q4 2016 | 0.7% | No significant difference | 1.8% | Significant increase | 3.7% | Significant increase |
| Q1 2017 | 0.7% | No significant difference | 2.0% | Significant increase | 3.3% | Significant increase |
| Q2 2017 | 0.6% | No significant difference | 2.0% | Significant increase | 3.4% | Significant increase |
| Q3 2017 | 0.5% | No significant difference | 1.9% | Significant increase | 3.8% | Significant increase |
| Q4 2017 | 0.6% | No significant difference | 2.0% | Significant increase | 3.2% | Significant increase |
| Q1 2018 | 0.6% | No significant difference | 1.8% | Significant increase | 3.3% | Significant increase |
| Q2 2018 | 0.6% | No significant difference | 1.7% | No significant difference | 3.3% | Significant increase |
| Q3 2018 | 0.5% | No significant difference | 1.7% | No significant difference | 3.1% | No significant difference |
| Q4 2018 | 0.5% | No significant difference | 1.5% | No significant difference | 3.3% | Significant increase |
| Q1 2019 | 0.4% | No significant difference | 1.3% | No significant difference | 3.4% | Significant increase |
| Q2 2019 | 0.5% | No significant difference | 1.1% | No significant difference | 3.2% | Significant increase |
| Q3 2019 | 0.5% | No significant difference | 1.2% | No significant difference | 2.9% | No significant difference |
| Q4 2019 | 0.6% | No significant difference | 1.2% | No significant difference | 2.7% | No significant difference |
| Q1 2020 | 0.6% | No significant difference | 1.5% | No significant difference | 2.7% | No significant difference |
| Q2 2020 | 0.5% | No significant difference | 1.4% | No significant difference | 2.3% | No significant difference |
| Q3 2020 | 0.6% | No significant difference | 1.2% | No significant difference | 2.2% | No significant difference |
| Q4 2020 | 0.3% | No significant difference | 0.9% | Significant decrease | 2.0% | Significant decrease |
| Q1 2021 | 0.4% | No significant difference | 0.6% | Significant decrease | 1.9% | Significant decrease |
| Q2 2021 | 0.4% | No significant difference | 0.7% | Significant decrease | 2.0% | Significant decrease |
| Q3 2021 | 0.3% | No significant difference | 0.7% | Significant decrease | 1.9% | Significant decrease |
| Q4 2021 | 0.3% | No significant difference | 0.8% | Significant decrease | 1.9% | Significant decrease |
| Q1 2022 | 0.2% | Significant decrease | 0.9% | Significant decrease | 1.4% | Significant decrease |
| Q2 2022 | 0.2% | Significant decrease | 1.0% | No significant difference | 1.5% | Significant decrease |
| Q3 2022 | 0.3% | No significant difference | 1.1% | No significant difference | 1.8% | Significant decrease |
| Q4 2022 | 0.2% | No significant difference | 1.3% | No significant difference | 1.7% | Significant decrease |
| Q1 2023 | 0.3% | No significant difference | 1.2% | No significant difference | 1.8% | Significant decrease |
Problem gambling has averaged 0.5 percent over the period, with the incidence of problem gambling significantly lower in Quarter 1 and Quarter 2 2022 and higher during Quarter 3 2016. Men are significantly more likely to be classified as problem gamblers than women (0.8 percent versus 0.2 percent), while younger people are more likely to be classified as problem gamblers than older people (0.9 percent of 16 to 24 year olds versus 0.1 percent of those aged 65 and over).
1.4 percent were classified as moderate risk gamblers over the tracking period, with lows in 2020 (0.9 percent average across the year) and 2021 (0.8 percent) and a high in 2017 (2.0 percent). Men were more likely to be classified as moderate risk (1.9 percent) than women (0.9 percent), while 16 to 24 year olds were more likely to be classified as moderate risk than those aged 65 and over (2.2 percent versus 0.5 percent).
The incidence of low-risk gamblers averaged 2.6 percent across the tracking period, with a peak of 3.7 percent in 2016 and a low of 1.7 percent in 2022. Men were again more likely to be classified as low risk gamblers than women (3.5 percent versus 1.8 percent), while younger people were again more likely to be classified as low risk than older people (4.2 percent of 16 to 24 year olds versus 1.4 percent of those aged 65 and over).
Notes
1 For more information on the Short Form PGSI see: Developing a Short Form of the PGSI (PDF) (opens in new tab).
Incidence of problem gambling - Short Form PGSI individual statements
Figure 8: Percent of respondents who have experienced each of the short form PGSI statements in the last 12 months
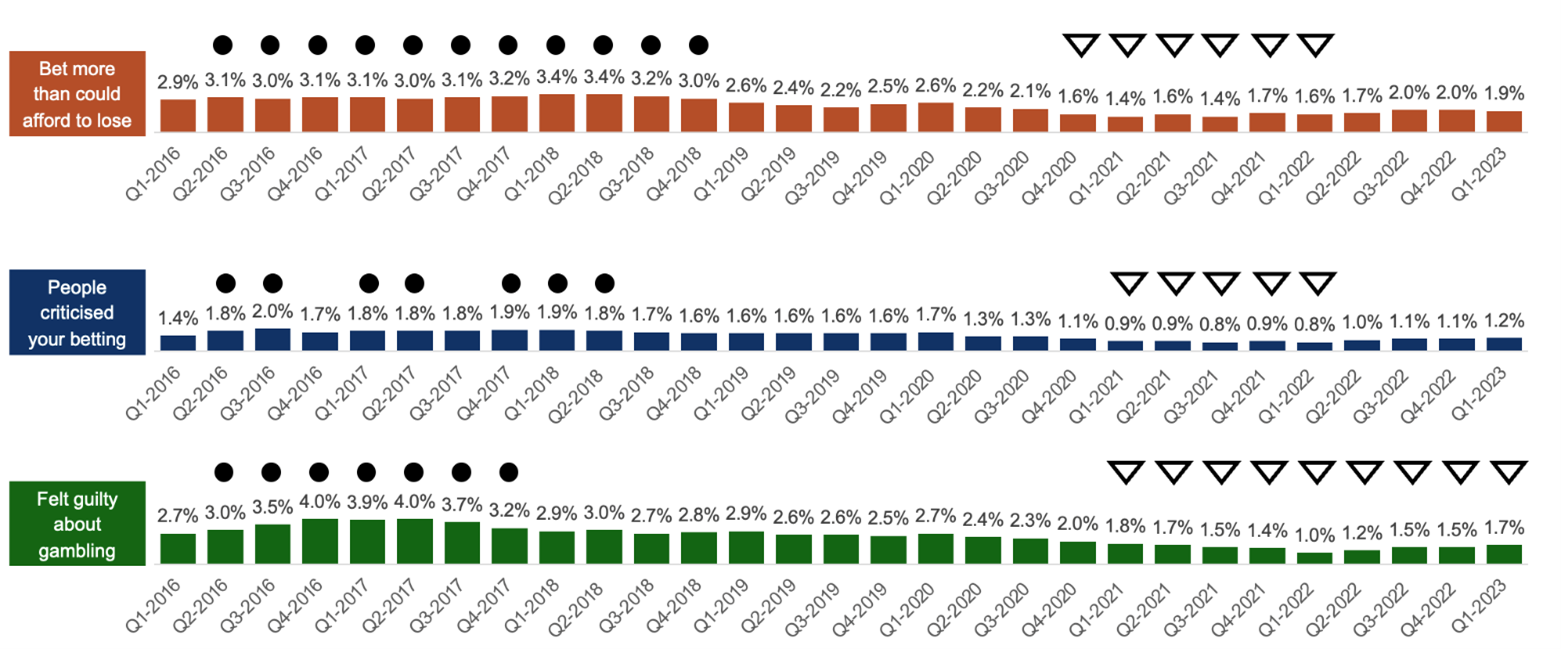
Figure 8 information
Question 7: "In the last 12 months have you bet more than you could really afford to lose?" Question 8: "In the last 12 months have people criticised your betting, or told you that you have a gambling problem, whether or not you thought it is true?" Question 9: "In the last 12 months have you felt guilty about the way you gamble or what happens when you gamble?" Base: All respondents (4000 to 4021 respondents) A filled circle is used next to data that is significantly higher than the average across the tracking period. A triangle outline is used next to data that is significantly lower than the average across the tracking period. This data is represented in the following data table.
| Quarter (Q) | Bet more than you could afford to lose | Difference between the reporting period and the average across the entire tracking period | People criticised your betting | Difference between the reporting period and the average across the entire tracking period | Felt guilty about gambling | Difference between the reporting period and the average across the entire tracking period |
|---|---|---|---|---|---|---|
| Q1 2016 | 2.9% | No significant difference | 1.4% | No significant difference | 2.7% | No significant difference |
| Q2 2016 | 3.1% | Significant increase | 1.8% | Significant increase | 3.0% | Significant increase |
| Q3 2016 | 3.0% | Significant increase | 2.0% | Significant increase | 3.5% | Significant increase |
| Q4 2016 | 3.1% | Significant increase | 1.7% | No significant difference | 4.0% | Significant increase |
| Q1 2017 | 3.1% | Significant increase | 1.8% | Significant increase | 3.9% | Significant increase |
| Q2 2017 | 3.0% | Significant increase | 1.8% | Significant increase | 4.0% | Significant increase |
| Q3 2017 | 3.1% | Significant increase | 1.8% | No significant difference | 3.7% | Significant increase |
| Q4 2017 | 3.2% | Significant increase | 1.9% | Significant increase | 3.2% | Significant increase |
| Q1 2018 | 3.4% | Significant increase | 1.9% | Significant increase | 2.9% | No significant difference |
| Q2 2018 | 3.4% | Significant increase | 1.8% | Significant increase | 3.0% | No significant difference |
| Q3 2018 | 3.2% | Significant increase | 1.7% | No significant difference | 2.7% | No significant difference |
| Q4 2018 | 3.0% | Significant increase | 1.6% | No significant difference | 2.8% | No significant difference |
| Q1 2019 | 2.6% | No significant difference | 1.6% | No significant difference | 2.9% | No significant difference |
| Q2 2019 | 2.4% | No significant difference | 1.6% | No significant difference | 2.6% | No significant difference |
| Q3 2019 | 2.2% | No significant difference | 1.6% | No significant difference | 2.6% | No significant difference |
| Q4 2019 | 2.5% | No significant difference | 1.6% | No significant difference | 2.5% | No significant difference |
| Q1 2020 | 2.6% | No significant difference | 1.7% | No significant difference | 2.7% | No significant difference |
| Q2 2020 | 2.2% | No significant difference | 1.3% | No significant difference | 2.4% | No significant difference |
| Q3 2020 | 2.1% | No significant difference | 1.3% | No significant difference | 2.3% | No significant difference |
| Q4 2020 | 1.6% | Significant decrease | 1.1% | No significant difference | 2.0% | No significant difference |
| Q1 2021 | 1.4% | Significant decrease | 0.9% | Significant decrease | 1.8% | Significant decrease |
| Q2 2021 | 1.6% | Significant decrease | 0.9% | Significant decrease | 1.7% | Significant decrease |
| Q3 2021 | 1.4% | Significant decrease | 0.8% | Significant decrease | 1.5% | Significant decrease |
| Q4 2021 | 1.7% | Significant decrease | 0.9% | Significant decrease | 1.4% | Significant decrease |
| Q1 2022 | 1.6% | Significant decrease | 0.8% | Significant decrease | 1.0% | Significant decrease |
| Q2 2022 | 1.7% | No significant difference | 1.0% | No significant difference | 1.2% | Significant decrease |
| Q3 2022 | 2.0% | No significant difference | 1.1% | No significant difference | 1.5% | Significant decrease |
| Q4 2022 | 2.0% | No significant difference | 1.1% | No significant difference | 1.5% | Significant decrease |
| Q1 2023 | 1.9% | No significant difference | 1.2% | No significant difference | 1.7% | Significant decrease |
Betting more than they can afford to lose
An average of 2.4 percent say that they have bet more than they can afford to lose in the last 12 months across the whole tracking period, with a high of 3.2 percent averaged across 2017 and 3.1 percent for 2016. This behaviour was significantly rarer in 2020 (1.6 percent across the year) and 2021 (1.7 percent). Despite a slight uptick in 2022, this percentage has still not returned to pre-pandemic levels.
The proportion betting more than they can afford to lose is significantly higher among men than women (3.1 percent versus 1.7 percent). The trend among men appears to be on a downwards trajectory – decreasing from 4.4 percent agreement in 2016 to 1.8 percent in 2021, while there is less of a distinct pattern among women.
Younger people are more likely to have bet more than they can afford to lose than older people (3.8 percent of those aged 16 to 24 versus 1.4 percent of those aged 65+), potentially linked to the disposable income that these age groups have. The proportion of over 65s agreeing with this statement reached a low of 0.3 percent in 2020 during the pandemic, down from 2.5 percent in 2016 and 1.1 percent in 2019. While rates of betting more than they can afford to lose have begun to increase in 2021 (1.3 percent) and 2022 (1.6 percent) they are still significantly lower than where they were prior to 2019, with the cost of living crisis potentially also having an impact on lower participation rates.
People criticising their betting
Across the tracking period 1.4 percent report having been criticised about their betting or told that they have a gambling problem. The proportion reporting this was on a downwards trajectory from 2018 until the beginning of 2022. Although having seen a slight upwards trend, rates remain below where they were pre-pandemic.
Men are more likely to be criticised for their betting than women (2.2 percent over the tracking period versus 0.7 percent for women), with men also driving the trend towards less criticism, from an average of 3.1 percent in 2017 decreasing annually to 1.1 percent in 2021. While returning to 1.5 percent in 2022 it is still significantly behind where it was prior to the pandemic.
Younger people are significantly more likely to have been criticised for their gambling behaviours than older people (2.8 percent of 16 to 24 year olds versus 0.5 percent of those aged 65 and over). Criticism of older people’s gambling habits decreased to nothing in 2020 during the Covid-19 pandemic, with only 0.2 percent reporting this in 2021.
Feeling guilty about the way they gamble or what happens when they gamble
2.5 percent of people reported feeling guilty about their gambling over the tracking period. Guilt was highest in 2016 (4 percent) and 2017 (3.2 percent). These feelings have been on a gradual decline since, with just 1.5 percent of respondents reporting this guilt in Quarter 4 2022.
As well as being more likely to bet more than they can afford to lose, men are also significantly more likely to feel guilt than women (3.6 percent versus 1.4 percent), with men experiencing a particularly peak in 2016 (6 percent experiencing these feelings of guilt). Consistent with the overall trend, both men and women have seen a reduction in their guilty feelings since 2016.
As well as being the most likely to have bet more than they can afford to lose and to have been criticised about their gambling, those aged 16 to 24 are also most likely to feel guilty about their gambling (4.0 percent). There is less of a clear downwards trend in terms of guilt among this age group.
Those aged 65 and over are the least likely to have felt guilty about their gambling behaviours across the period (0.7 percent), with lows of 0.3 percent in 2020 and 0.2 percent in 2021.
Key Conclusions
While there are some variations in participation over the tracking period, there has not been a dramatic or sustained increase in overall gambling participation, with rates significantly higher in 2016 than in 2022 and 2023.
In-person gambling activity was significantly impacted by the Covid-19 pandemic and is yet to return to pre-pandemic levels, particularly for Lottery participation. Online has now replaced in-person as the most frequently used National Lottery purchase method, with only those aged 65 and over still most often opting for in person methods.
Online participation has continued its steady increase over the tracking period, with the older age groups experiencing the most significant increases in online participation. While men are more likely to gamble online than women, both genders have seen an increase in online participation across the tracking period.
The proportion agreeing that gambling is conducted fairly and can be trusted peaked at the beginning of the tracking period, then continued on a downwards trajectory with significant lows from Quarter 3 2019 to Q3 2020. It has remained relatively stable since.
The period from the end of 2020 saw the proportion of respondents classified as moderate risk and low risk gamblers significantly decrease. The proportion of respondents classified as problem gamblers peaked in Quarter 3 2016 and has remained relatively stable since.