
Report
Illegal online gambling - Phase 3: Understanding push factors for consumer engagement with illegal gambling websites
The Gambling Commission's research into consumer engagement with the illegal online gambling market.
Influences shaping illegal gambling website usage
Key findings
- Awareness of industry tools and checks as a banner term is high, but true understanding of the mechanics is low: While self-reported awareness is highest for gambling management tools, the Gambling Commission, and identity checks, true understanding often lags. Respondents frequently confuse different types of checks with each other (such as identity, financial vulnerability, fraud and anti-money laundering source of funds), sometimes using Know Your Customer (KYC) as a catch-all term.
- Deliberate, low-frequency behaviours are the strongest factors tied to illegal gambling website use: Routine actions (like browsing for better odds) are common, but advanced analytics shows that deliberate, less frequent behaviours, such as looking for websites not blocked by GamStop or avoiding personal data checks, have stronger links to illegal gambling website use.
- Different push factors are stronger in different audiences:
- Skilled Advocates report the highest frequency of deliberate behaviours (for example, actively seeking non-GamStop sites), reflecting their more intentional use of illegal websites
- Accidental Tourists appear to be driven more by friction on licensed websites (such as trouble with withdrawals or account restrictions) rather than a deliberate search for alternatives
- Social Explorers sit between the two; these deliberate behaviours are relatively uncommon for them, but they act as a strong indicator of illegal website use when they do occur.
Notes for readers
A definition of terminology mentioned in this section, such as PGSI, KYC checks, RTP and GamStop, can be found in our ‘How to read’ section.
Descriptions for each of the personas can be found in the ‘Exploring the persona audiences’ section.
Awareness of, incidence and importance of these influences
As identified in previous phases of work, there are specific behaviours or ‘indicators’ associated with consumer usage of illegal gambling websites. The quantitative survey measured awareness and experience of a number of factors that influence gambling, including potential ‘push factors’ that may contribute to the use of illegal gambling websites.
Awareness and understanding
Self-reported awareness of factors that may influence play is highest for gambling management tools (83% of illegal website users surveyed), the Gambling Commission (82%) and identity checks (72%), with lower awareness of more technical or third-party mechanisms. Understanding broadly follows the same pattern, although understanding of the Commission stands out: while 82% are aware of it, only 26% report a good understanding.
Across all mechanisms tested, self-reported awareness is significantly higher among those scoring 8 to 27 on the Problem Gambling Severity Index (PGSI), and is also consistently higher among those who indicate they have engaged with illegal gambling websites. As shown in Table 3, the largest gaps in awareness between the personas versus the total sample of illegal gambling website users are for more specialist concepts such as Gamban and financial vulnerability checks.
Table 3: Awareness of potential push factors: Which of the following, if any, are you aware of in the context of online gambling?
| Net: Aware | Total (percentage) | PGSI 8+ (percentage) | Skilled Advocate (percentage) | Social Explorer (percentage) | Accidental Tourist (percentage) |
|---|---|---|---|---|---|
| Gambling management tools, such as financial limits, self-exclusion, reality checks | 83% | 89% | 90% | 87% | 86% | The Gambling Commission | 82% | 88% | 88% | 87% | 86% | Identity checks, also known as Know Your Customer (KYC) checks | 72% | 86% | 92% | 87% | 79% | Rules applying to online fruit, slot, or virtual gaming | 68% | 85% | 90% | 82% | 73% | Financial risk assessments | 66% | 83% | 87% | 83% | 75% | Account restrictions or bans (may also be referred to as "gubbing") | 65% | 83% | 86% | 81% | 75% | Financial vulnerability checks | 64% | 82% | 87% | 83% | 75% | Source-of-funds checks | 59% | 80% | 87% | 76% | 64% | GAMSTOP | 54% | 79% | 86% | 72% | 59% | Statutory Gambling Levy | 47% | 74% | 81% | 64% | 52% | Return to Player (RTP) | 46% | 76% | 84% | 68% | 48% | GamProtect | 43% | 72% | 81% | 63% | 48% | Gamban | 37% | 69% | 76% | 56% | 42% |
Base: All survey participants (N=4,007)
Table 3.1. Awareness of potential push factors: Which of the following, if any, are you aware of in the context of online gambling?
| Net: Aware | Total (percentage) | Aware of this but do not understand (percentage) | Aware of this and have some understanding (percentage) | Aware of this and have a good understanding (percentage) |
|---|---|---|---|---|
| Gambling management tools, such as financial limits, self-exclusion, reality checks | 83% | 13% | 32% | 38% | The Gambling Commission | 82% | 25% | 31% | 26% | Identity checks, also known as Know Your Customer (KYC) checks | 72% | 14% | 24% | 33% | Rules applying to online fruit, slot, or virtual gaming | 68% | 17% | 27% | 23% | Financial risk assessments | 66% | 19% | 25% | 22% | Account restrictions or bans (may also be referred to as "gubbing") | 65% | 13% | 24% | 28% | Financial vulnerability checks | 64% | 16% | 27% | 21% | Source-of-funds checks | 59% | 14% | 24% | 20% | GAMSTOP | 54% | 14% | 19% | 21% | Statutory Gambling Levy | 47% | 17% | 17% | 13% | Return to Player (RTP) | 46% | 12% | 17% | 17% | GamProtect | 43% | 12% | 16% | 15% | Gamban | 37% | 11% | 14% | 13% |
Base: All survey participants (N=4,007)
Taking total claimed ‘awareness’ specifically, Table 4 shows that Skilled Advocates have a higher claimed awareness across all factors, in particular checks or assessments.
Table 4: NET: Awareness of push factors that may influence experiences: Which of the following, if any, are you aware of in the context of online gambling? by Persona
| Net: Aware | Total (percentage) | Skilled Advocates (percentage) | Social Explorers (percentage) | Accidental Tourists (percentage) |
|---|---|---|---|---|
| Gambling management tools, such as financial limits, self-exclusion, reality checks | 83% | 90% | 87% | 86% | Identity checks, also known as Know Your Customer (KYC) checks | 72% | 92% | 87% | 79% | Rules applying to online fruit, slot, or virtual gaming | 68% | 90% | 82% | 73% | Financial risk assessments | 66% | 87% | 83% | 75% | Account restrictions or bans (may also be referred to as "gubbing") | 65% | 86% | 81% | 75% | Financial vulnerability checks | 64% | 87% | 81% | 70% | Source-of-funds checks | 59% | 87% | 76% | 64% | Return to Player (RTP) | 46% | 84% | 68% | 48% |
Base: All survey participants (N=4,007) NB. Low base sizes for persona groups, interpret with caution.
Where respondents said they were aware and understood identity and/or KYC checks, financial vulnerability checks, or Source of Funds checks, they were asked a follow up question to explain how they think it could impact their gambling. Broadly, respondents self-report that they are comfortable in describing checks in general, but often confuse the different types with each other, with ‘KYC checks’ sometimes acting as a catch-all term that sits all ‘checks’.
"I'm not entirely sure how this [financial checks] differs from 'source of funds' which I understand more clearly"
Skilled Advocate, Male, 51 years old.
Despite this potential gap between stated awareness and actual understanding, the perceived understanding, that is higher in Skilled Advocates than other groups, has a material impact on how they perceive their experience in the legal gambling market, and the factors they perceive to have driven them over to the illegal market.
Incidence of the push factors
Reported behaviours follow a clear pattern, with more common behaviours being more routine actions such as browsing for better odds (42% of illegal website users surveyed), avoiding websites where personal data felt unsafe (41%) and submitting identity documents (36%). Behaviours more closely associated with illegal gambling websites are less prevalent, including using websites with limited data requirements (19%), sites without financial checks (16%) and looking for websites not blocked by GamStop or Gamban (12%).
Incidence is significantly higher among those scoring 8 or 27 on the PGSI, and highest among Skilled Advocates. When reviewing these figures, readers should remember that these percentages represent proportions within these specific, minority users of those who engage in illegal online gambling, rather than the wider audience of those who gamble. As shown in Table 5, deliberate behaviours are particularly elevated among Skilled advocates; 52% report looking for sites not blocked by GamStop or Gamban and 64% using sites requiring limited personal data, compared with 12% and 19% overall.
Table 5: Potential push factors experienced: In the last 3 months, have you experienced any of the following while using gambling websites?
| NET: Yes, frequently and/or sometimes | Total (percentage) | PGSI 8+ (percentage) | Skilled Advocates (percentage) | Social Explorers (percentage) | Accidental Tourists (percentage) |
|---|---|---|---|---|---|
| Browsed for websites with better odds | 42% | 56% | 63% | 63% | 56% |
| Avoided sites where I didn't think my personal data would be safe | 41% | 53% | 61% | 54% | 52% | Submitted documents proving my identity | 36% | 53% | 62% | 54% | 43% | Looked for different gambling games to play | 35% | 55% | 64% | 54% | 41% | Looked for different websites to have fun on | 34% | 53% | 63% | 55% | 41% | Browsed for websites with better RTP (Return to Player) | 26% | 47% | 65% | 46% | 32% | Found sites where I could still use Autoplay / turbo / slam stops | 23% | 41% | 57% | 29% | 23% | Used sites that I knew would not ask for much personal data | 19% | 47% | 64% | 34% | 27% | Used sites without financial checks | 16% | 39% | 53% | 26% | 24% | Had trouble with withdrawals | 14% | 35% | 44% | 20% | 19% | Looked for sites not blocked by GAMSTOP / Gamban | 12% | 37% | 52% | 20% | 13% | Had my account restricted | 11% | 29% | 42% | 13% | 16% | Played on crypto casinos | 10% | 33% | 49% | 19% | 9% |
Base: All survey participants (N=4,007). Low base sizes for persona groups, interpret with caution.
Frequency and importance of the push factors
Key driver analysis was used to how strongly each factor is linked to use of illegal gambling websites, measured against the Illegal Incidence Index.
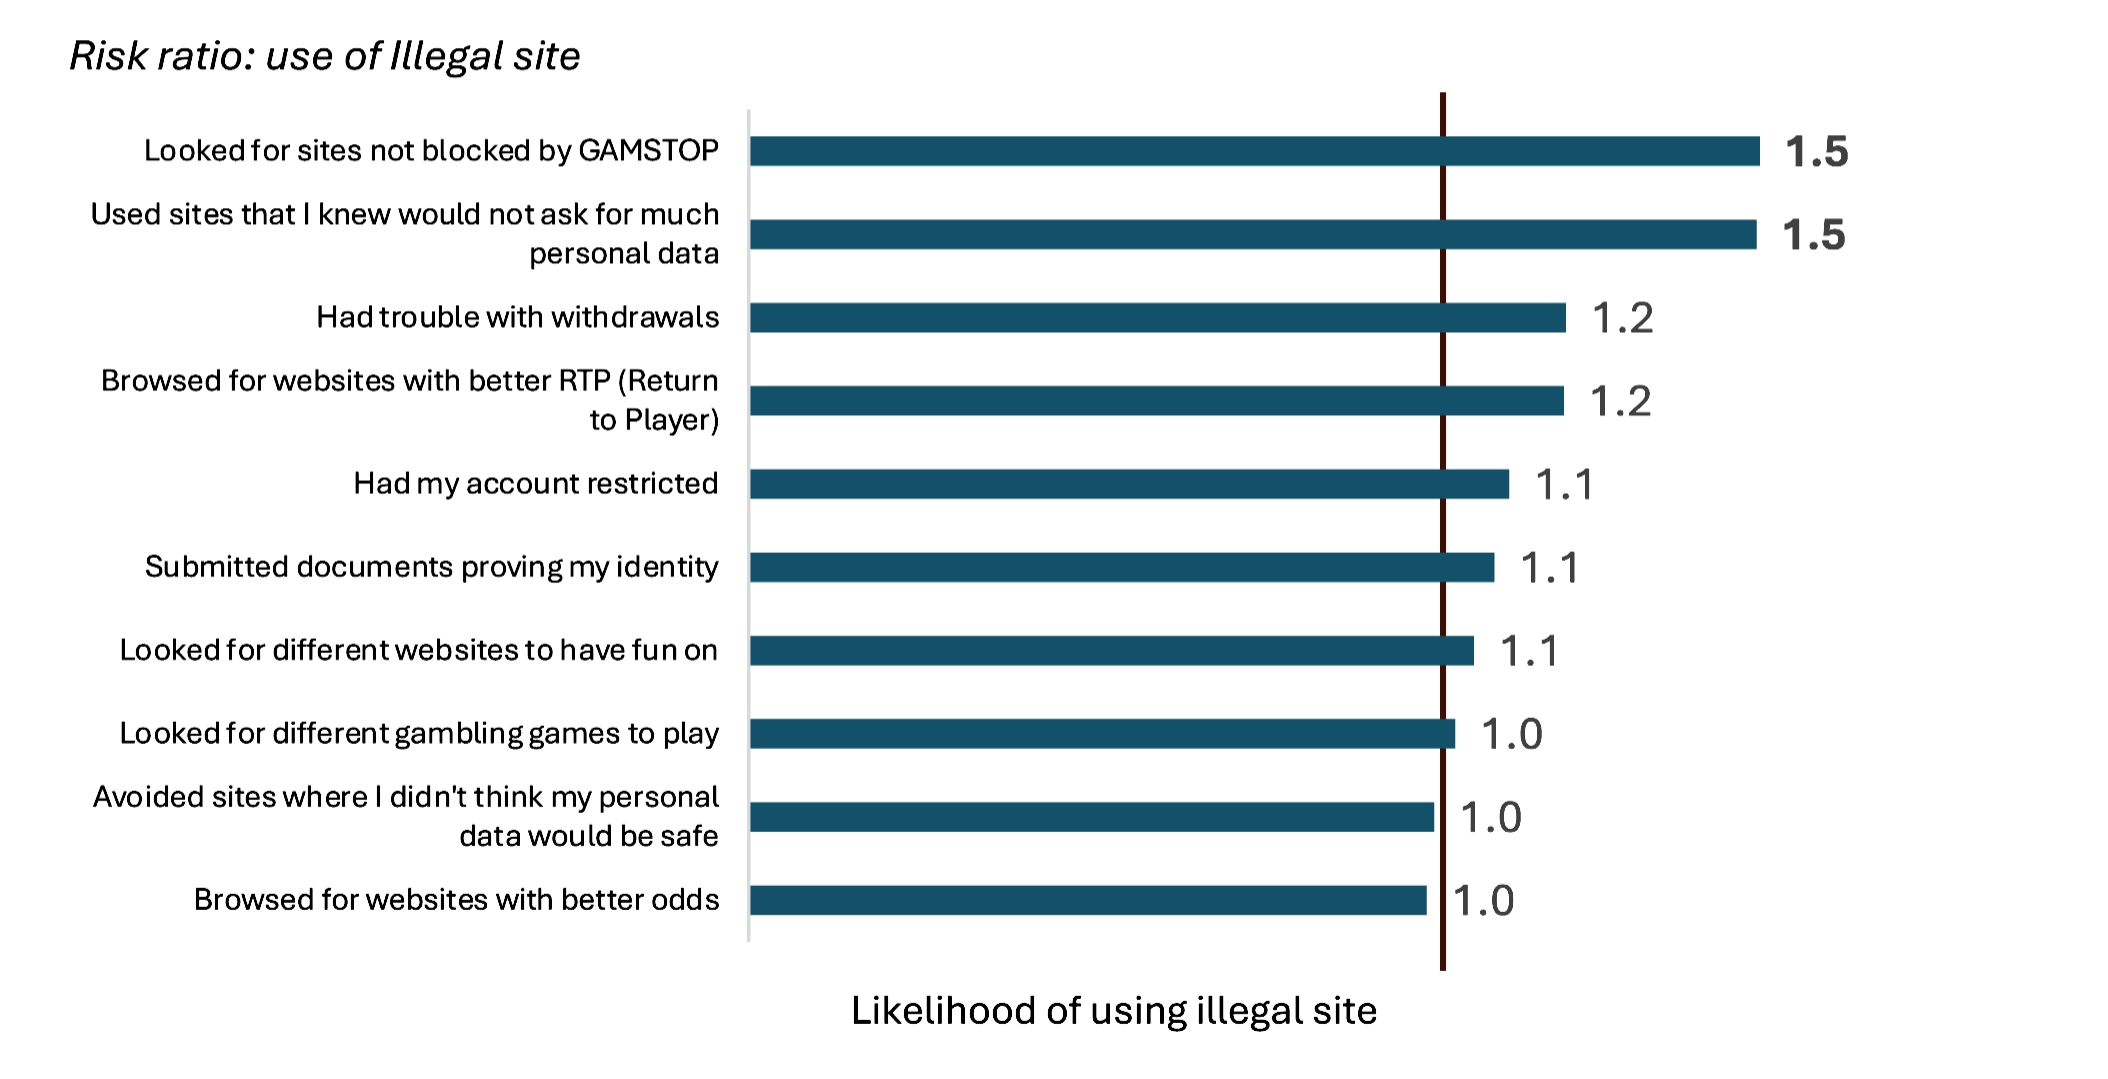
In the digital intelligence, we found that looking for websites not blocked by GamStop, has become a widely understood shortcut for a suite of features believed to be associated with the illegal online gambling market, rather than purely being a niche term for those who are self-excluded. When tested quantitatively, this behaviour has the strongest link to illegal gambling website use, despite being one of the least commonly reported behaviours, followed by using websites known to not ask for much personal data. The risk ratio analysis reinforces this; those reporting either of these 2 behaviours frequently or sometimes of illegal website users surveyed, are around 1.5 times more likely to use an illegal gambling website than those who reported that they do so rarely or never (see Figure 1). In contrast, more common factors such as browsing for better odds or different games have little independent link to illegal gambling website use.
Figure 1. Risk ratio: use of illegal gambling websites
| Behaviour or experience | Risk ratio: likelihood of using illegal gambling websites |
|---|---|
| Looked for sites not blocked by GAMSTOP | 1.5 |
| Used sites that I knew would not ask for much personal data | 1.5 |
| Had trouble with withdrawals | 1.2 |
| Browsed for websites with better RTP (Return to Player) | 1.2 |
| Had my account restricted | 1.1 |
| Submitted documents proving my identity | 1.1 |
| Looked for different websites to have fun on | 1.1 |
| Looked for different gambling games to play | 1.0 |
| Avoided sites where I didn’t think my personal data would be safe | 1.0 |
| Browsed for website with better odds | 1.0 |
E5. In the last 3 months, have you experienced any of the following while using gambling websites?
Base: All survey participants (N=4,007).
Risk ratio analysis compares those that report a behaviour frequently/sometimes versus those that do so rarely and/or never.
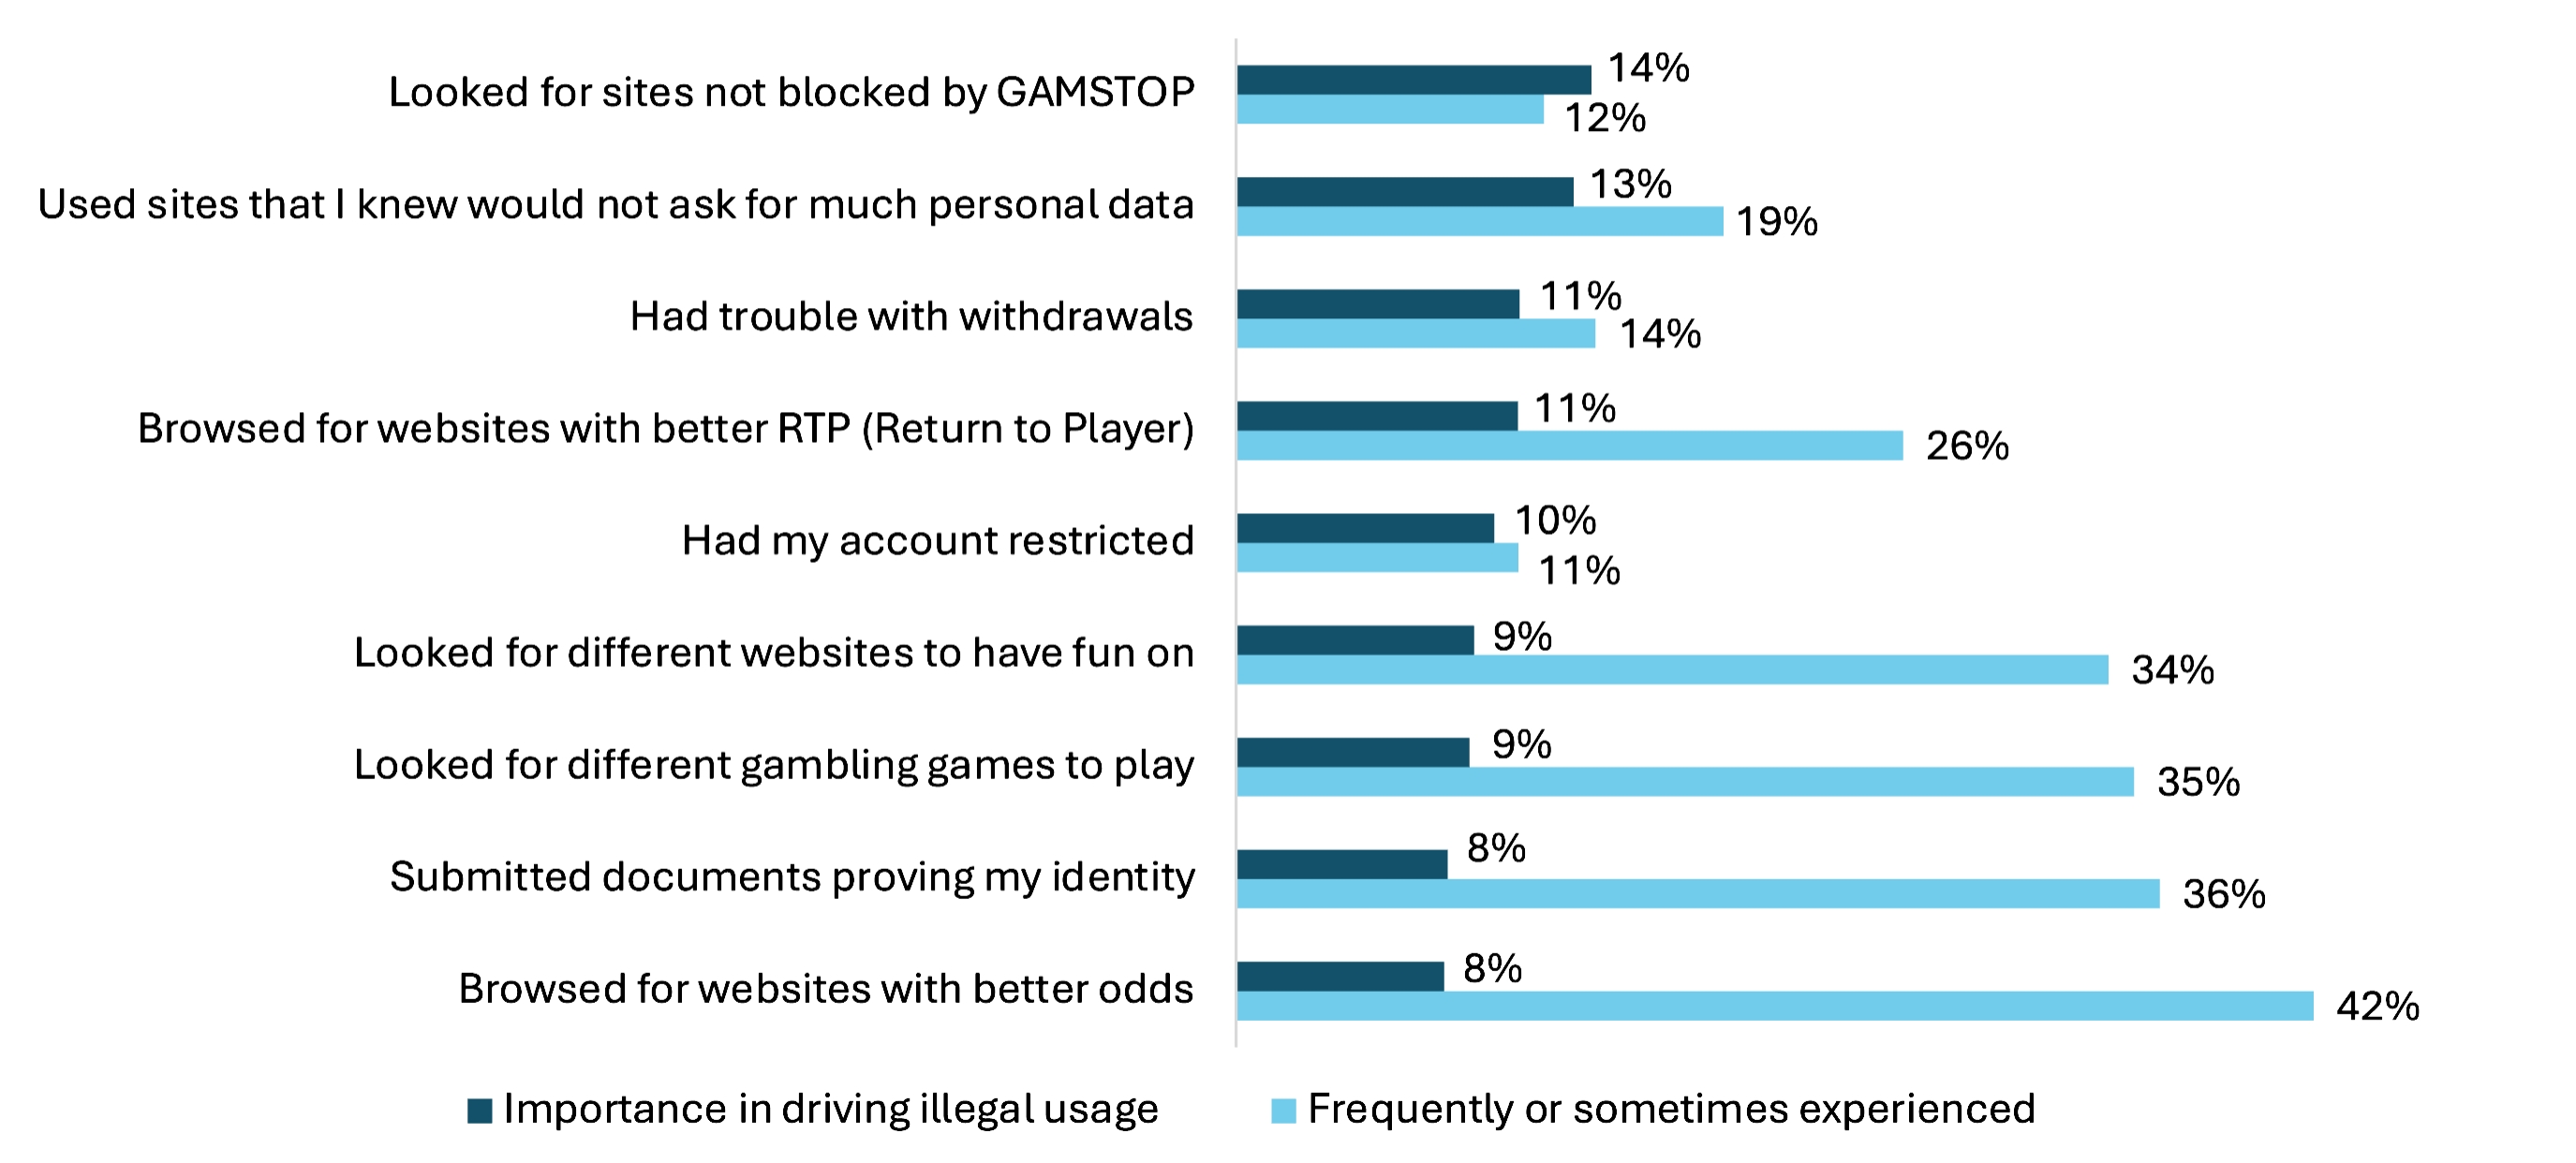
As shown in Figure 2, the pattern shows that lower-frequency, more deliberate behaviours are the strongest drivers of illegal website usage, while more common behaviours tend to have less influence. This suggests that behaviours which appear marginal on incidence alone may be the most important to monitor.
Figure 2: Importance in driving illegal gambling website use, against frequency experienced
| Push factor | Importance (percentage) | Frequently experienced or sometimes (percentage) |
|---|---|---|
| Looked for sites not blocked by GAMSTOP | 14% | 12% |
| Used sites that I knew would not ask for much personal data | 13% | 19% |
| Had trouble with withdrawals | 11% | 14% |
| Browsed for websites with better RTP (Return to Player) | 11% | 26% |
| Had my account restricted | 10% | 11% |
| Looked for different websites to have fun on | 9% | 34% |
| Looked for different gambling games to play | 9% | 35% |
| Submitted documents proving my identity | 8% | 36% |
| Browsed for website with better odds | 8% | 42% |
Base: All survey participants (N=4,007). Key drivers analysis, conducted using the full scale of likelihood to report each activity plus E5. Frequency of experiences.
How this differs by group
Looking for non-GamStop websites and websites that are known for not asking for much personal data broadly remain the top drivers across all 4 groups, but both how often each behaviour is experienced and how much weight it carries vary considerably.
Table 6. Push factors reportedly experienced ‘frequently’ or ‘sometimes’, by group
| Push factor | PGSI 8+ (percentage) | Skilled Advocates (percentage) | Social Explorers (percentage) | Accidental Tourists (percentage) |
|---|---|---|---|---|
| Looked for sites not blocked by GAMSTOP | 37% | 52% | 20% | 13% |
| Used sites that I knew would not ask for much personal data | 47% | 64% | 34% | 27% | Browsed for websites with better RTP (Return to Player) | 47% | 65% | 46% | 32% |
| Had trouble with withdrawals | 35% | 44% | 20% | 19% |
| Had my account restricted | 29% | 42% | 13% | 16% |
| Submitted documents proving my identity | 53% | 62% | 54% | 43% |
| Looked for different websites to have fun on | 53% | 63% | 55% | 41% |
| Looked for different gambling games to play | 55% | 64% | 54% | 41% |
| Avoided sites where personal data did not feel safe | 53% | 61% | 54% | 52% |
| Browsed for website with better odds | 56% | 63% | 63% | 56% |
Base: All survey participants (N=4,007). Percentage experiencing each behaviour frequently or sometimes in the last three months.
Table 7: Relative importance of each reported push factor in driving illegal online gambling website use, by persona group
| Push factor | Skilled Advocates (percentage) | Social Explorers (percentage) | Accidental Tourists (percentage) |
|---|---|---|---|
| Looked for sites not blocked by GAMSTOP | 13% | 17% | 12% |
| Used sites that I knew would not ask for much personal data | 11% | 16% | 14% | Browsed for websites with better RTP (Return to Player) | 11% | 10% | 10% |
| Had trouble with withdrawals | 10% | 12% | 13% |
| Had my account restricted | 10% | 9% | 12% |
| Submitted documents proving my identity | 9% | 7% | 4% |
| Looked for different websites to have fun on | 10% | 6% | 8% |
| Looked for different gambling games to play | 10% | 8% | 10% |
| Avoided sites where personal data did not feel safe | 6% | 7% | 4% |
| Browsed for website with better odds | 10% | 7% | 7% |
Base: All survey participants (N=4,007). Key drivers analysis, showing relative importance within each group.
Skilled Advocates have a lower range of importance across the factors, with results spread between 9% and 13%. They also report the highest incidence of deliberate behaviours, including looking for non-GamStop websites (52% of illegal website users surveyed) and websites known for not asking for much personal data (64%), reflecting the more ingrained nature of their use of illegal gambling websites. Browsing for better return to player (RTP) is also prominent, reported by 65% and accounting for 11 percent of importance, consistent with the deal-conscious, value-seeking profile outlined in previous sections.
Social Explorers show the clearest gap between frequency and importance, across some measures: for example, using websites known for not asking for much personal data is reported by only 34% of Social Explorers, but accounts for 16% importance (which is second highest importance of all the factors). This behaviour is therefore relatively uncommon but highly diagnostic when they occur. Browsing for better return to player is the exception, reported by 46% and still acting as a moderately important driver.
Accidental Tourists are the clearest exception. Their drivers are more evenly spread and centre on relatively innocuous experiences, with trouble with withdrawals (13% of illegal website users surveyed), having an account restricted (12%) and looking for different games (10%) among the strongest. Searching for non-GamStop websites are both their least common behaviour (13%) and least important driver (12%). This suggests that, for Accidental Tourists, friction within the licensed market is more likely to push them towards illegal gambling websites than a deliberate search for alternatives.
Previous sectionAttitudes towards gambling companies and regulation Next section
Exploring attitudes towards push factors and influences in more depth
Last updated: 20 October 2026
Show updates to this content
No changes to show.