Report
Illegal online gambling: Challenges of estimating the size of the illegal gambling market
The final chapter of the Gambling Commission's research into the illegal online market, focusing on challenges estimating the size of the market.
Dwell-time approach
Key point summary
Key points in this section are as follows:
- the dwell-time approach requires several assumptions to create a reliable estimate of the size of the illegal market: each stage of the methodology can be outlined – providing a transparent approach and creating a pathway to systematically improve each area of assumptions
- at present, insufficient data is available to refine assumptions so that an estimate can be viewed as robust, reliable and fit for public use.
In this section we explore the approach, and associated challenges, of estimating the size of the illegal market using a ‘dwell time’ based methodology. This uses engagement data as a starting point – and applies adjustments and assumptions to convert this into an estimate of money spent by consumers.
Our engagement estimate is based on the number of identified site visits, average visit duration and an assumption regarding VPN usage. Details of this can be found in Illegal online gambling: Consumer engagement and trends. To convert this engagement metric into an estimate of GGY, further assumptions have to be made to account for:
- the different gambling activities undertaken on illegal sites
- the associated levels of expenditure with each gambling activity
- time that has passed since data was collected to support the previously mentioned assumptions
- consideration of different factors which could influence whether consumers spend more, or less, on illegal websites compared to when they use legal sites
- the proportion of website visit time actively spent gambling.
The following sections provide further detail on each of these assumptions, available data and the key caveats which affect the reliability of estimates produced.
Different gambling activities undertaken on illegal sites
We first need to understand which gambling activities consumers take part in on illegal websites. Through our Consumer Voice research, consumers identified as having gambled on illegal websites in the last 4 weeks were asked, ‘When you have used unlicensed websites in the last 4 weeks, what types of gambling activities do you usually take part in?’ The findings are set out in the following table.
Figure 1: Gambling activity participation, Consumer Voice
| Activity | Percentage (%) | 95 percent confidence interval |
|---|---|---|
| Betting | 34% | 25% to 43% |
| Slots | 13% | 7% to 19% |
| Casino | 16% | 9% to 23% |
| Poker | 10% | 5% to 15% |
| Bingo | 14% | 8% to 20% |
| Instant win games | 13% | 7% to 19% |
Note: Number of participants is 117
This survey provides a useful insight into consumer past gambling participation. The research, however, is based on a relatively small sample, meaning that confidence intervals are large and while the data provides useful insights specifically on individuals who use illegal gambling websites, the sample may not be entirely representative.
Expenditure by gambling activity type
Data is also needed on spend per minute to allow us to generate an estimate of overall expenditure gambling. Patterns of Play1 research provides a useful source of evidence. This provides data on spend per minute for slots, casino, poker, bingo and instant win games. The Patterns of Play findings for expenditure per minute are set out in the following table.
Figure 2: Gross Gambling Yield (GGY) per minute while actively gambling in legal market
| Activity | GGY per minute (£) |
|---|---|
| Betting | Unknown from patterns of play |
| Slots | 0.32 |
| Casino | 1.12 |
| Poker | 0.19 |
| Bingo | 0.07 |
| Instant win games | 0.09 |
The key limitation of this dataset, however, is that betting data was recorded by bet, not by session time, so we don’t have an appropriate GGY per minute figure to apply to traffic associated with betting activity.
We also acknowledge that, unlike participation in slots or casino games where time on site and expenditure will be more closely correlated, time spent on site for betting activities is a less useful way of estimating overall likely levels of expenditure for this activity. This limitation can be addressed by re-weighting the data for activities where data is available – but this nonetheless omits betting data from the estimate.
Time elapsed
The Patterns of Play research is based on account-level data from 2018 to 2019 and may not accurately reflect the gambling behaviour of consumers today. GGY per minute can be affected by a number of factors – including changes in Return to Player (RTP), website structure, games available, the shift to mobile, and the mix of verticals and/or games.
In order to account for these changes, we explored using gambling operator data that we collect and publish quarterly: Gambling business data on gambling to March 2025 (published May 2025). This provides a proxy for changes in GGY per minute. There are several caveats, however, that must be considered when using this data:
- this dataset includes several of the largest online operators accounting for approximately 70 percent of the online market
- free bets and spins are included
- session lengths are an average of all the averages submitted by operators in the data set.
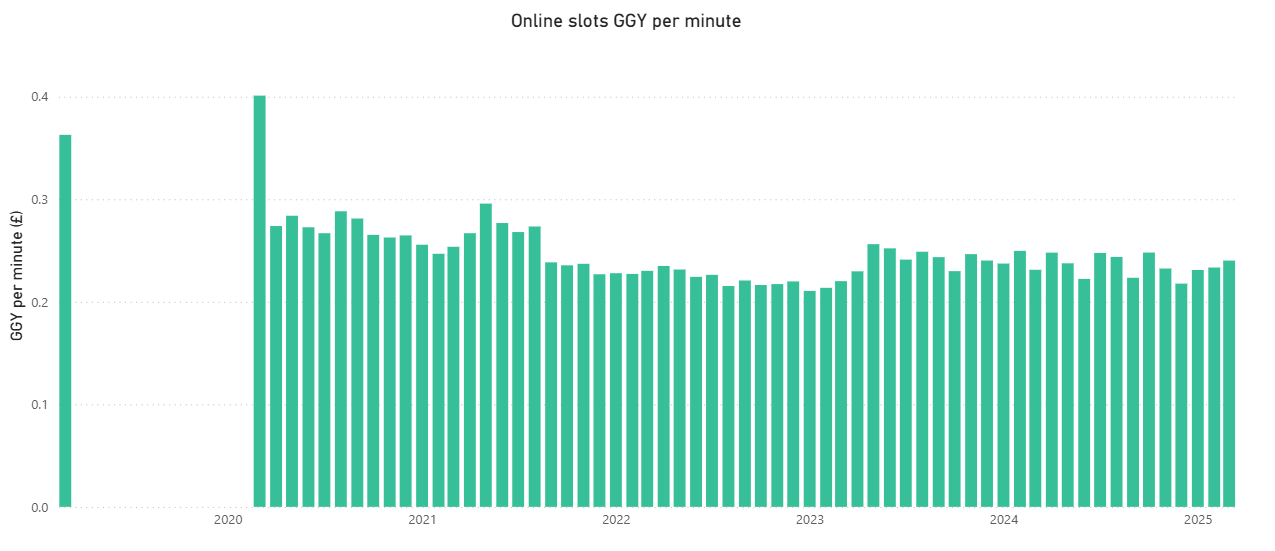
This data suggests that GGY per minute for slots was £0.36 in March 2019. This is similar to the £0.32 per minute from Patterns of play from 2018 to 2019. However, it is important to note the sharp drop in GGY per minute between March 2019 and April 2020 in the gambling business data, which has a significant impact on using this data to adjust our estimates. This is likely due to COVID-19 and the lockdown which influenced consumers gambling habits.
This dataset suggests that while total GGY for slots has increased since 2019, the number of sessions has also increased and average session length has decreased, with a £0.24 GGY per minute in March 2025 for slots. When comparing to the £0.32 pence per minute from Patterns of Play, this represents a 25 percent decrease in GGY per minute for slots on licensed websites.
We currently do not have equivalent data for other gambling activities, such as casino games and bingo. More data is therefore needed to better estimate changes across different product types.
Figure 3: Online slots GGY per minute2
| Year | January | February | March | April | May | June | July | August | September | October | November | December |
|---|---|---|---|---|---|---|---|---|---|---|---|---|
| 2019 | No data | No data | £0.36 | No data | No data | No data | No data | No data | No data | No data | No data | No data | 2020 | No data | No data | £0.40 | £0.27 | £0.28 | £0.27 | £0.27 | £0.29 | £0.28 | £0.27 | £0.26 | £0.26 | 2021 | £0.26 | £0.25 | £0.25 | £0.27 | £0.30 | £0.28 | £0.27 | £0.27 | £0.24 | £0.24 | £0.26 | £0.26 | 2022 | £0.23 | £0.23 | £0.23 | £0.23 | £0.23 | £0.22 | £0.22 | £0.22 | £0.22 | £0.22 | £0.22 | £0.22 | 2023 | £0.21 | £0.21 | £0.22 | £0.23 | £0.26 | £0.25 | £0.24 | £0.25 | £0.24 | £0.23 | £0.25 | £0.24 | 2024 | £0.24 | £0.25 | £0.23 | £0.25 | £0.24 | £0.22 | £0.25 | £0.24 | £0.22 | £0.25 | £0.23 | £0.22 | 2025 | £0.23 | £0.23 | £0.24 | No data | No data | No data | No data | No data | No data | No data | No data | No data |
Differences in expenditure on illegal and legal gambling
It is possible that consumers gambling expenditure will be different when they use an illegal website compared to their gambling activity on legal websites. From qualitative interviews with consumers, it appears likely that spending behaviour will differ based on motivations for accessing the illegal market. For example:
- more engaged consumers, and those attempting to avoid restrictions placed on them in the legal market might be higher than average spenders
- consumers exploring new websites or products have described spending less money than they usually would.
- gambling behaviour when using cryptocurrencies, may also differ to when using traditional forms of payment.
Without behavioural data on spending behaviour, and with surveys generally deemed unreliable for estimating consumer spending, making an evidence-based assumption is highly challenging.
Proportion of time spent gambling
Our engagement metric is based on data combining numbers of visits to websites and the duration of these visits. We recognise, however, that not all time on a website will be spent actively gambling. Time will also be used to browse products, register and deposit money. An assumption is therefore needed to reflect this.
To adjust our data to better reflect time spent actively gambling, we can apply our GGY estimation methodology to the legal market. We can do this by:
- collecting data on visits and visit duration for legal gambling websites – this gives us an estimate of total minutes of engagement with the legal online market
- applying the previous stages to estimate how much expenditure this would equate to if the entirety of this time was spent gambling
- comparing this to data on reported GGY from legal online gambling for the same period
- using the ratio between the 2 as a proxy for the ratio between time spent gambling and other activity
- using the ration to rescale our estimate for engagement on illegal websites.
The limitation of this approach is that people’s activity on legal and illegal sites might differ in a way that means the same ratio cannot be applied to both contexts – for example, illegal sites might have fewer registration requirements meaning less time is required to complete this stage of activity. However, this may be counteracted by the effect of illegal websites being disrupted, meaning consumers will have to re-register with new sites more often.
Summary
The ‘dwell-time’ approach allows us to attempt to convert objective estimates of engagement data using known data from legal market. This requires several assumptions to be made – each introducing additional uncertainty to these estimates. The key assumptions and limitations are set out in the following paragraphs. We have also highlighted the key opportunities to improve this methodology and refine estimates. Further work on these actions is required before we will reach a position where reliable estimates can be published.
Gambling activities participated in – to more accurately estimate expenditure
Data source: Consumer Voice.
Effect on reliability: Medium - We have a relatively low sample size for our survey of consumers who have used illegal sites.
Opportunities to improve: Larger surveys and more research on activities consumers take part in on illegal sites.
Estimate of expenditure per minute by gambling activity type – to reflect different levels of expenditure by activity
Data source: Patterns of Play.
Effect on reliability: High - The key gap in this dataset relates to the absence of betting data.
Opportunities to improve: Operators can support us by sharing data to help us make more accurate assumptions on the relationship between time on site and expenditure.
Time elapsed – To reflect consumer behaviour will have changed since Patterns of Play data was collected in 2019 to 2020
Data source: Patterns of Play, Market Insight data.
Effect on reliability: High - We do not currently have data to allow us to make a reliable estimate. Anecdotally, we expect behaviour to be different – but this will differ for consumers with different motivations and awareness of using illegal websites.
Opportunities to improve: This will require further primary research – challenges, however, are noted given limitations of surveys on recall of expenditure.
Proportion of time spent gambling – To reflect that not all time on a website will be spent gambling.
Data source: SimilarWeb, Industry Statistics.
Effect on reliability: Medium - The ratio we calculate can only be seen as a proxy – there are many factors which mean that behaviour on illegal and illegal sites may differ.
Opportunities to improve: More primary research will help us understand how consumer behaviour differs between legal and illegal contexts.
References
1 Patterns of Play (opens in a new tab) was a study commissioned by GambleAware and conducted by the National Centre for Social Research (NatCen) in collaboration with the University of Liverpool, which was published in 2022. It used a combination of qualitative interviews with consumers, and account-level data from legal gambling operators to better understand gambling behaviour. This account-level data covers a twelve-month period from 1st July 2018 to 30th June 2019 and includes figures for GGY per minute were calculated for various gambling activities.
2 Source of this data is in our Market Impact of COVID-19 release.
Comparisons of different methodologies - Challenges of estimating the size of the illegal gambling market Next section
Channelisation rate approach - Challenges of estimating the size of the illegal gambling market
Last updated: 6 November 2025
Show updates to this content
No changes to show.