- Print the full document
- Save the page as a HTML document to your device
- Save the page as a PDF file
- Bookmark it - it will always be the latest version of this document
This box is not visible in the printed version.
Illegal online gambling: Challenges of estimating the size of the illegal gambling market
The final chapter of the Gambling Commission's research into the illegal online market, focusing on challenges estimating the size of the market.
Published: 6 November 2025
Last updated: 6 November 2025
This version was printed or saved on: 4 July 2026
Online version: https://www.gamblingcommission.gov.uk/report/illegal-online-gambling-challenges-of-estimating-the-size-of-the-illegal
Executive summary
Estimating the scale of the market is a worthwhile goal – it helps us understand if our work to disrupt this market is achieving success by making it difficult for illegal gambling to be offered at scale to consumers in Great Britain. It also demonstrates the need for wider action, from a range of stakeholders in order to achieve a sustainable reduction in this risk to consumers in Great Britain.
Different methodologies can be used to estimate the scale of this market – each have benefits and limitations. This report explores these different approaches and outlines opportunities to develop them further.
We have focused on methodologies based on objective data. This provides the opportunity to clearly explain levels of uncertainty associated with estimates and creates options to access new data to refine assumptions and improve them.
We note concern over reliability of estimates based on surveys which require consumers to recall previous illegal gambling expenditure with any accuracy.
Having examined different methodologies, we are not yet in a position to make a robust and reliable estimate of the size of this market.
We have identified actions to be taken to address these limitations – creating a pathway towards developing an estimate of the size of this market which is fit for public use.
We urge caution over any estimates presented by third parties or commentators which don’t have a transparent methodology, or which do not show how the challenges in this report have been considered, or that provide precise ‘point estimates’ without clarity of the associated margins for error and caveats.
Introduction and context
Key point summary
Key points in this section are as follows:
- this report builds on our previously published approach to estimating trends of consumer engagement with illegal gambling websites. We have explored how we can develop this work further to make an estimate of the overall size of this market – in terms of consumer expenditure – or the Gross Gambling Yield (GGY) - associated with it
- estimating amounts of illegal activity in any sector is a significant challenge, due to its nature. We have sought to take a realistic, informed approach – this means we are clear about the limitations of available data and the uncertainty of estimates we can make
- we are not yet ready to publish an estimate. In this report we explain the reasons for this and opportunities to work towards this goal. Understanding the size of this market is important – but we will only publish an estimate that we judge to be credible and fit for public use
This report discusses the work we have undertaken to explore the size of the illegal gambling market in Great Britain. We highlight different methodologies that can be applied and examine the challenges of making robust and reliable estimates for an activity which is largely hidden and for which available data is limited.
We will never know the exact amount that is being spent within the illegal market. That said, although a definitive estimate of the size of this market is currently out of reach, it is a realistic goal to work towards and we will publish our findings when they are ready. In this report we set out the factors that make a definitive estimate difficult and explain the actions which can be taken to overcome these.
The Gambling Commission, as a public body, can only publish data that we see as robust and reliable. We follow the principles and approach set out in the Government’s AQuA Book1. In particular, we have sought to be clear about the uncertainty associated with estimates and have been transparent about the methodologies used and limitations involved. We will only publish data when we assess it as suitably reliable and fit for public use.
We look forward to working with academia, operators, other regulators and stakeholders to make progress towards this goal.
Why estimate the size of the illegal gambling market
The Gambling Commission has a strategic objective of making it difficult for illegal gambling to be offered at scale to consumers in Great Britain. This is a priority as this market poses a risk to members of the public and damages legitimate businesses.
The benefits of being able to estimate the size of this market include:
- helping us to understand the scale of risk posed to consumers and the public – so we can allocate existing resources proportionately and further demonstrate the case for wider action by stakeholders who can play a role in tackling this problem
- helping us to further understand the overall impact of our disruption work – building on the progress already made on monitoring trends in engagement and the impact of disruption on specific sites
- allowing us to work internationally with other regulators to develop and deploy robust methodologies which will allow us to benchmark Great Britain with other jurisdictions.
Context
This report is the fourth report in our series of publications on illegal gambling.
Publication 1 – Illegal online gambling: Consumer awareness, drivers and motivations explored the factors that motivate consumers to use illegal sites – and the extent that they understand if they are using a regulated operator. One of the key messages from this analysis, based on engagement with many consumers, was that motivations are varied and cannot be explained by a single factor.
Publication 2 – Illegal online gambling: Consumer engagement and trends focused on trends in consumers engagement with illegal sites. A large number of illegal websites exist and are used by consumers. Analysis of trends, however, showed no evidence of persistent growth in their use. More work is needed to explore of fluctuations observed are seasonal variations, or part of a longer-term trend.
Publication 3 – Illegal online gambling: Disruption of illegal online gambling highlighted how we disrupt illegal websites and how we are continuing to strengthen our approach to enforcement. This report also illustrated how we can measure the impact of disruption activity on illegal websites.
Scope of this report
We define illegal gambling as the facilitation of commercial gambling to consumers in Great Britain without an operating licence from the Gambling Commission or a valid exemption for non-commercial gambling. This applies regardless of where in the world the gambling is provided from. A gambling licence issued in another country does not permit a company to provide gambling to consumers in Great Britain. The illegal online market is characterised by a complex interplay of operators, affiliates, payment methods, and access channels. Since the illegal market is not subject to our regulation and the safeguarding this provides, there is a high rate of change as new technologies and products emerge.
In Illegal online gambling: Consumer engagement and trends we set out the scope of our data collection in more detail. The key points to note include:
- we recognise that illegal land-based gambling is also a risk to the licensing objectives– however, our focus for this report has been the online sector as there is more potential to access data to estimate the scale of this aspect of the market
- any illegal gambling websites will look similar or identical to legal sites - many consumers may be using them without knowing they are not licensed by the Gambling Commission
- access to illegal sites will also be facilitated by use of Virtual Private Networks (VPNs) – this is discussed in report 2 and included in our estimate of engagement trends
- use of crypto casinos is a notable feature of many of the illegal websites we have identified. These often appear alongside more traditional gambling products
- illegal gambling can also be facilitated directly within Social Media Apps, such as Telegram. At present, we have not identified a methodology that would accurately capture this activity.
Structure of this report
This report is structured as follows:
- the Methodology section outlines strengths and weaknesses of methodology options
- the Dwell-time approach section – Focuses on the ‘dwell-time’ methodology – outlining the challenges of making accurate estimates and opportunities to develop this approach
- the Channelisation rate approach section sets out a similar analysis of ‘channelisation’ based methodologies
- the final part provides a discussion on conclusions and next steps.
1 The AQuA Book (opens in new tab), Government Operational Research Service, Government Analysis Function, Government Actuary’s Department, Office for National Statistics, July 2025.
Comparisons of different methodologies
Key point summary
Key points in this section are as follows:
- we have explored three main approaches to estimating the scale of the illegal online gambling market
- of these approaches, we have not pursued developing a survey-based methodology as we consider the underlying data to be too unreliable as we know that consumers’ recall of past expenditure in gambling surveys is generally poor: efforts to refine estimates through further assumptions are unlikely to lead to reliable results as the underlying core data is already flawed
- we are focusing on methodologies where assumptions can be clearly stated and improved over time as more data becomes available: this provides the opportunity of a pathway to more reliable estimates suitable for publication.
We have explored 3 main approaches to estimating the scale of the illegal online gambling market. In this section, we provide an overview of each and provide an overview of their strengths and weaknesses.
Dwell time approach – This converts data on engagement and ‘time-spent-on-site’ into expenditure estimates. This assumes that more visits to illegal websites, and longer visit duration, will be associated with higher levels of expenditure. Several assumptions must be made to generate financial estimates – this requires us to use data from known behaviour on legal websites and adjust this to develop an estimate of illegal gambling activity.
Channelisation approach – This is based on making a comparison between data on legal and illegal ‘channels’ of engagement with gambling. Our Illegal online gambling: Consumer engagement and trends report sets out our approach to estimating consumer engagement with illegal websites. This approach can also be used to obtain estimates of engagement with legal websites. The 2 datasets can then be benchmarked with each other. As we have data on levels of Gross Gambling Yield (GGY) associated with the legal market, this can be used as a starting point for making an estimate of GGY associated with illegal activity.
Survey based approach – Consumer surveys can be used to ask consumers directly about their past experiences of using illegal sites. Results can be scaled up to generate a population level estimate of consumer expenditure on illegal websites.
Strengths and weaknesses
Dwell-time approach
Strengths
This approach is based on objective measures of estimated engagement with illegal gambling websites. Our approach to generating these estimates is set out in Report 2 Our Illegal online gambling: Consumer engagement and trends report. Although initial estimates of engagement are already subject to margins for error, these margins have been estimated and quantified using statistical techniques. This allows uncertainty to be better understood and communicated.
Assumptions can then be applied to provide a more refined estimate of expenditure on these sites. These assumptions can be improved as more data becomes available – allowing us to move towards a more reliable estimate.
Weaknesses
This approach requires multiple assumptions to convert estimates of engagement into estimates of expenditure – such as differences in levels of expenditure between legal and illegal gambling and the proportion of visit time to a website which is actively spent gambling.
Each additional assumption adds additional margins for error – collectively these can add up to create significant uncertainty over the estimates.
Channelisation
Strengths
As with the ‘dwell time’ approach, the foundation for this is objective data on estimated engagement with legal and illegal gambling.
Trends in illegal engagement can be compared with data with more established understanding of consumer activity in the legal gambling market.
Assumptions must still be applied to generate reliable estimates. These can be set out and improved as more data becomes available.
This approach also allows us to observe and compare seasonality in data in comparison to more established trends in the legal market.
Weaknesses
This approach also requires multiple assumptions which, when combined, introduce significant margins for error.
Survey-based methodology
Strengths
Survey data can be easily collected – making it a relatively low-cost approach to developing an estimate.
Weaknesses
We know that consumers recall of gambling expenditure is unreliable1. For this reason, we do not ask respondents about past expenditure in the Gambling Survey for Great Britain (GSGB). Nor were questions used in the previous Health Surveys.
Assumptions still need to be applied to scale up survey responses – but as these assumptions must be applied to already unreliable data, we consider the overall uncertainty of any estimates generated through this approach to be extremely high.
In addition to concerns about reliability of recall, obtaining a representative sample of consumers who have used the illegal market is challenging – especially as we know from past research that many consumers do not know if the websites they are using are regulated in Great Britain or not.
Conclusions on methodologies to develop further
In summary, we have focused on exploring ‘dwell time’ and ‘channelisation’ approaches to understanding the size of the illegal online gambling market as likely to provide a more robust estimate.
1 Accuracy of self-reported gambling frequency and outcomes: Comparisons with account data (opens in new tab); Heirene, Wang, Gainsbury; Psychology of Addictive Behaviours; 2021.
Dwell-time approach
Key point summary
Key points in this section are as follows:
- the dwell-time approach requires several assumptions to create a reliable estimate of the size of the illegal market: each stage of the methodology can be outlined – providing a transparent approach and creating a pathway to systematically improve each area of assumptions
- at present, insufficient data is available to refine assumptions so that an estimate can be viewed as robust, reliable and fit for public use.
In this section we explore the approach, and associated challenges, of estimating the size of the illegal market using a ‘dwell time’ based methodology. This uses engagement data as a starting point – and applies adjustments and assumptions to convert this into an estimate of money spent by consumers.
Our engagement estimate is based on the number of identified site visits, average visit duration and an assumption regarding VPN usage. Details of this can be found in Illegal online gambling: Consumer engagement and trends. To convert this engagement metric into an estimate of GGY, further assumptions have to be made to account for:
- the different gambling activities undertaken on illegal sites
- the associated levels of expenditure with each gambling activity
- time that has passed since data was collected to support the previously mentioned assumptions
- consideration of different factors which could influence whether consumers spend more, or less, on illegal websites compared to when they use legal sites
- the proportion of website visit time actively spent gambling.
The following sections provide further detail on each of these assumptions, available data and the key caveats which affect the reliability of estimates produced.
Different gambling activities undertaken on illegal sites
We first need to understand which gambling activities consumers take part in on illegal websites. Through our Consumer Voice research, consumers identified as having gambled on illegal websites in the last 4 weeks were asked, ‘When you have used unlicensed websites in the last 4 weeks, what types of gambling activities do you usually take part in?’ The findings are set out in the following table.
Figure 1: Gambling activity participation, Consumer Voice
| Activity | Percentage (%) | 95 percent confidence interval |
|---|---|---|
| Betting | 34% | 25% to 43% |
| Slots | 13% | 7% to 19% |
| Casino | 16% | 9% to 23% |
| Poker | 10% | 5% to 15% |
| Bingo | 14% | 8% to 20% |
| Instant win games | 13% | 7% to 19% |
Note: Number of participants is 117
This survey provides a useful insight into consumer past gambling participation. The research, however, is based on a relatively small sample, meaning that confidence intervals are large and while the data provides useful insights specifically on individuals who use illegal gambling websites, the sample may not be entirely representative.
Expenditure by gambling activity type
Data is also needed on spend per minute to allow us to generate an estimate of overall expenditure gambling. Patterns of Play1 research provides a useful source of evidence. This provides data on spend per minute for slots, casino, poker, bingo and instant win games. The Patterns of Play findings for expenditure per minute are set out in the following table.
Figure 2: Gross Gambling Yield (GGY) per minute while actively gambling in legal market
| Activity | GGY per minute (£) |
|---|---|
| Betting | Unknown from patterns of play |
| Slots | 0.32 |
| Casino | 1.12 |
| Poker | 0.19 |
| Bingo | 0.07 |
| Instant win games | 0.09 |
The key limitation of this dataset, however, is that betting data was recorded by bet, not by session time, so we don’t have an appropriate GGY per minute figure to apply to traffic associated with betting activity.
We also acknowledge that, unlike participation in slots or casino games where time on site and expenditure will be more closely correlated, time spent on site for betting activities is a less useful way of estimating overall likely levels of expenditure for this activity. This limitation can be addressed by re-weighting the data for activities where data is available – but this nonetheless omits betting data from the estimate.
Time elapsed
The Patterns of Play research is based on account-level data from 2018 to 2019 and may not accurately reflect the gambling behaviour of consumers today. GGY per minute can be affected by a number of factors – including changes in Return to Player (RTP), website structure, games available, the shift to mobile, and the mix of verticals and/or games.
In order to account for these changes, we explored using gambling operator data that we collect and publish quarterly: Gambling business data on gambling to March 2025 (published May 2025). This provides a proxy for changes in GGY per minute. There are several caveats, however, that must be considered when using this data:
- this dataset includes several of the largest online operators accounting for approximately 70 percent of the online market
- free bets and spins are included
- session lengths are an average of all the averages submitted by operators in the data set.
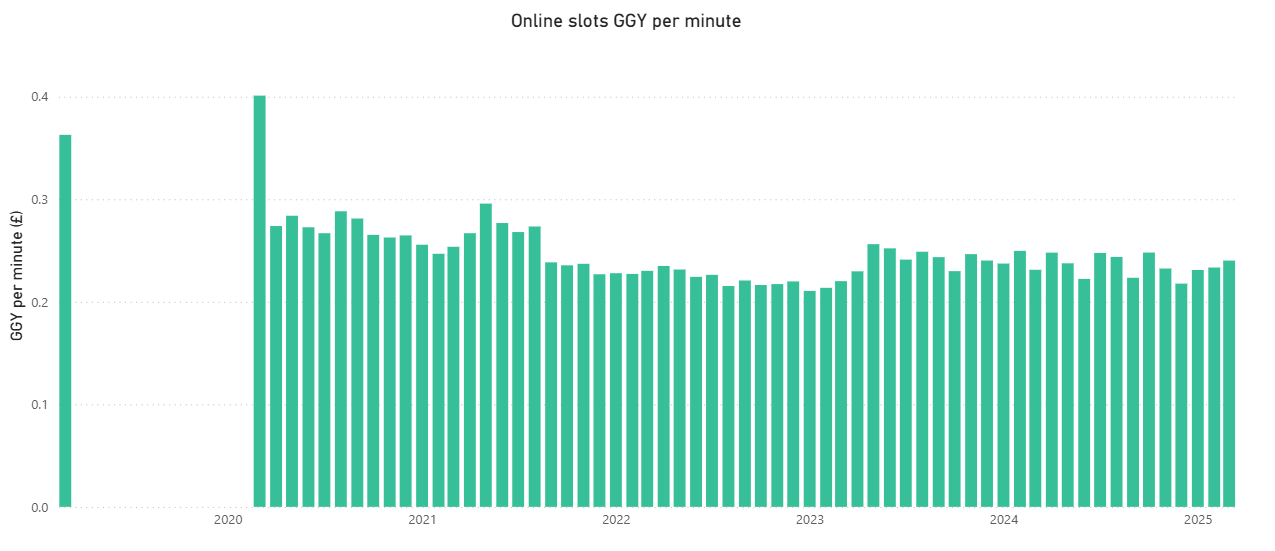
This data suggests that GGY per minute for slots was £0.36 in March 2019. This is similar to the £0.32 per minute from Patterns of play from 2018 to 2019. However, it is important to note the sharp drop in GGY per minute between March 2019 and April 2020 in the gambling business data, which has a significant impact on using this data to adjust our estimates. This is likely due to COVID-19 and the lockdown which influenced consumers gambling habits.
This dataset suggests that while total GGY for slots has increased since 2019, the number of sessions has also increased and average session length has decreased, with a £0.24 GGY per minute in March 2025 for slots. When comparing to the £0.32 pence per minute from Patterns of Play, this represents a 25 percent decrease in GGY per minute for slots on licensed websites.
We currently do not have equivalent data for other gambling activities, such as casino games and bingo. More data is therefore needed to better estimate changes across different product types.
Figure 3: Online slots GGY per minute2
| Year | January | February | March | April | May | June | July | August | September | October | November | December |
|---|---|---|---|---|---|---|---|---|---|---|---|---|
| 2019 | No data | No data | £0.36 | No data | No data | No data | No data | No data | No data | No data | No data | No data | 2020 | No data | No data | £0.40 | £0.27 | £0.28 | £0.27 | £0.27 | £0.29 | £0.28 | £0.27 | £0.26 | £0.26 | 2021 | £0.26 | £0.25 | £0.25 | £0.27 | £0.30 | £0.28 | £0.27 | £0.27 | £0.24 | £0.24 | £0.26 | £0.26 | 2022 | £0.23 | £0.23 | £0.23 | £0.23 | £0.23 | £0.22 | £0.22 | £0.22 | £0.22 | £0.22 | £0.22 | £0.22 | 2023 | £0.21 | £0.21 | £0.22 | £0.23 | £0.26 | £0.25 | £0.24 | £0.25 | £0.24 | £0.23 | £0.25 | £0.24 | 2024 | £0.24 | £0.25 | £0.23 | £0.25 | £0.24 | £0.22 | £0.25 | £0.24 | £0.22 | £0.25 | £0.23 | £0.22 | 2025 | £0.23 | £0.23 | £0.24 | No data | No data | No data | No data | No data | No data | No data | No data | No data |
Differences in expenditure on illegal and legal gambling
It is possible that consumers gambling expenditure will be different when they use an illegal website compared to their gambling activity on legal websites. From qualitative interviews with consumers, it appears likely that spending behaviour will differ based on motivations for accessing the illegal market. For example:
- more engaged consumers, and those attempting to avoid restrictions placed on them in the legal market might be higher than average spenders
- consumers exploring new websites or products have described spending less money than they usually would.
- gambling behaviour when using cryptocurrencies, may also differ to when using traditional forms of payment.
Without behavioural data on spending behaviour, and with surveys generally deemed unreliable for estimating consumer spending, making an evidence-based assumption is highly challenging.
Proportion of time spent gambling
Our engagement metric is based on data combining numbers of visits to websites and the duration of these visits. We recognise, however, that not all time on a website will be spent actively gambling. Time will also be used to browse products, register and deposit money. An assumption is therefore needed to reflect this.
To adjust our data to better reflect time spent actively gambling, we can apply our GGY estimation methodology to the legal market. We can do this by:
- collecting data on visits and visit duration for legal gambling websites – this gives us an estimate of total minutes of engagement with the legal online market
- applying the previous stages to estimate how much expenditure this would equate to if the entirety of this time was spent gambling
- comparing this to data on reported GGY from legal online gambling for the same period
- using the ratio between the 2 as a proxy for the ratio between time spent gambling and other activity
- using the ration to rescale our estimate for engagement on illegal websites.
The limitation of this approach is that people’s activity on legal and illegal sites might differ in a way that means the same ratio cannot be applied to both contexts – for example, illegal sites might have fewer registration requirements meaning less time is required to complete this stage of activity. However, this may be counteracted by the effect of illegal websites being disrupted, meaning consumers will have to re-register with new sites more often.
Summary
The ‘dwell-time’ approach allows us to attempt to convert objective estimates of engagement data using known data from legal market. This requires several assumptions to be made – each introducing additional uncertainty to these estimates. The key assumptions and limitations are set out in the following paragraphs. We have also highlighted the key opportunities to improve this methodology and refine estimates. Further work on these actions is required before we will reach a position where reliable estimates can be published.
Gambling activities participated in – to more accurately estimate expenditure
Data source: Consumer Voice.
Effect on reliability: Medium - We have a relatively low sample size for our survey of consumers who have used illegal sites.
Opportunities to improve: Larger surveys and more research on activities consumers take part in on illegal sites.
Estimate of expenditure per minute by gambling activity type – to reflect different levels of expenditure by activity
Data source: Patterns of Play.
Effect on reliability: High - The key gap in this dataset relates to the absence of betting data.
Opportunities to improve: Operators can support us by sharing data to help us make more accurate assumptions on the relationship between time on site and expenditure.
Time elapsed – To reflect consumer behaviour will have changed since Patterns of Play data was collected in 2019 to 2020
Data source: Patterns of Play, Market Insight data.
Effect on reliability: High - We do not currently have data to allow us to make a reliable estimate. Anecdotally, we expect behaviour to be different – but this will differ for consumers with different motivations and awareness of using illegal websites.
Opportunities to improve: This will require further primary research – challenges, however, are noted given limitations of surveys on recall of expenditure.
Proportion of time spent gambling – To reflect that not all time on a website will be spent gambling.
Data source: SimilarWeb, Industry Statistics.
Effect on reliability: Medium - The ratio we calculate can only be seen as a proxy – there are many factors which mean that behaviour on illegal and illegal sites may differ.
Opportunities to improve: More primary research will help us understand how consumer behaviour differs between legal and illegal contexts.
1 Patterns of Play (opens in a new tab) was a study commissioned by GambleAware and conducted by the National Centre for Social Research (NatCen) in collaboration with the University of Liverpool, which was published in 2022. It used a combination of qualitative interviews with consumers, and account-level data from legal gambling operators to better understand gambling behaviour. This account-level data covers a twelve-month period from 1st July 2018 to 30th June 2019 and includes figures for GGY per minute were calculated for various gambling activities.
2 Source of this data is in our Market Impact of COVID-19 release.
Channelisation rate approach
Key point summary
The key points for this section are
- ‘Channelisation rate’ is an internationally recognised term. It refers to the amount of gambling activity which takes place through legal ‘channels’ compared to illegal ones. The higher the channelisation rate, the more activity is undertaken through the legal market
- comparative data can be obtained for legal websites in the same way we collect data to estimate engagement with illegal gambling. This approach has the benefit of involving fewer assumptions than the ‘dwell time’ approach. More work is needed, however, to verify our estimates using data from the licensed market
This section explores the ‘channelisation’ approach to estimating the size of the illegal gambling market. At a high-level the methodology involves:
- creating an estimate of engagement with illegal websites using the methodology set out in Illegal online gambling: Consumer engagement and trends
- the same methodology can be applied to collect data on engagement with all regulated, and therefore legal gambling websites
- the 2 estimates can be combined – allowing a comparison between legal and illegal ‘channels’ for engaging with gambling: this allows calculation of a ‘channelisation rate’ for illegal gambling compared to legal activity
- using data on Gross Gambling Yield (GGY) associated with legal online gambling as a starting point to estimate GGY from illegal channels
- applying assumptions to reflect differences between consumer behaviour on legal and illegal channels.
The following sections provide further detail on each stage of the methodology and key assumptions.
Estimating engagement with the legal market
We have created a list of all websites associated with operators licensed by the Gambling Commission. This information is taken from the public register of operators from our website1 . We can use SimilarWeb to obtain estimates of numbers of visits and visit duration. There are still some limitations, however, that need to be considered.
We note that legal gambling takes place via Apps as well as through websites . Although some illegal gambling activity is facilitated through Apps, we do not typically observe App-based versions of the illegal websites we identify from web searches and from affiliate platforms. Given the likely strong degree of App-based spend in the legal market, we also need to obtain web traffic data for both Apps-based and website-based engagement with legal sites. SimilarWeb provides estimates of both. Ideally, we would benefit from operators’ insights to help us verify the accuracy of these estimates.
Applying published data on legal online GGY
We collect and publish data on online GGY for the legal market. The key limitation to apply this to generate an estimate of GGY for the illegal market relates to the margins of error associated with each estimate.
As seen in Illegal online gambling: Consumer engagement and trends – the margin for error associated with our estimates for the illegal market are significant. Although this still provides a useful basis for understanding broad trends, absolute figures need to be treated with caution. Similar margins for error exist for data on engagement with legal websites. When combining 2 data points, both with significant margins for error, the uncertainty for accuracy of the ratio between these 2 datasets will be even greater.
A small percentage difference in a channelisation rate equates to a very large amount of GGY. For example, latest Industry Statistics covering the period April 2023 to March 2024 shows a total online GGY of £6.9 billion. If channelisation rate estimates are out by just 0.5 percent, this would a difference of £34.5 million in the associated estimate of GGY.
Differences in expenditure on illegal and legal
Once accuracy of engagement estimates has been improved to the point GGY data can be applied in a reliable way, a key assumption will need to be applied to reflect how patterns of expenditure differ on illegal sites compared to legal ones. The ‘channelisation rate’ reflects data on engagement – but a given amount of engagement may lead to different levels of expenditure for illegal gambling.
As discussed previously, the direction of this difference is only understood anecdotally, and we do not have robust evidence to support a more refined assumption. Further consumer research will be required to achieve this.
Summary
This approach has the potential to provide useful insights, but more work is needed to verify the accuracy of estimates of web traffic and App use in the legal market to allow reliable channelisation rates to be estimated.
One of the key potential advantages of the channelisation approach is that we can use the opportunity to explore seasonality in the well-established datasets on legal gambling – and assess the extent these can be observed in illegal channels for engagement.
Estimating engagement with legal websites and Apps
Data source: SimilarWeb.
Effect on reliability: Medium - Web traffic estimates can be obtained through Simlarweb. There are opportunities to calculate and verify margins of error associated with these estimates.
Opportunities to improve: We can collaborate with operators to verify the accuracy of Similarweb estimates of web traffic to licensed websites and explore the differences between estimates of website and App-based traffic.
Applying GGY data on the legal market
Data source: Similarweb and Market Insight data.
Effect on reliability: High - GGY data can be applied from the legal market – margins for error, however, increase when 2 estimates are combined.
Opportunities to improve: We can collaborate with operators to verify accuracy of Similarweb estimates and put ourselves in a better position to explain margins for error this will provide a stronger basis for applying data on GGY.
Accounting for differences in consumer behaviour between legal and illegal channels
Data source: Similarweb and Market Insight data.
Effect on reliability: High - We do not currently have data to allow us to make a reliable estimate. Anecdotally, we expect behaviour to be different – but this will differ for consumers with different motivations and awareness of using illegal websites.
Opportunities to improve: More consumer research to understand differences between illegal and legal gambling behaviour.
Conclusions and next steps
Key point summary
The key points for this section are
- although we are not yet able to make an estimate of the scale of the illegal gambling market, this paper sets out the wide range of considerations needed to make further progress
- options to improve our data sources and assumptions are outlined and delivering these will make up our planned programme of work
- progress will require collaboration with stakeholders, including academia, operators and other regulators.
Further development of the 2 methodologies explored in this report have the potential to allow us to make useful estimates of the size of the illegal gambling market. Although more work is needed to improve the assumptions underpinning these estimates, options have been identified that open-up a pathway to allow a robust estimate. Annex A sets out these options and their feasibility in greater detail.
Developing this estimate is a worthwhile exercise. We recognise that several third parties have published estimates. Whilst we welcome the focus on this issue, and recognise the concern stakeholders have about illegal gambling, we urge caution over use of estimates where the methodologies are not clear and levels of uncertainty are not set out.
Whilst we work to further improve our estimates, we will continue to:
- collect data on illegal sites to prioritise our operational work to disrupt illegal websites
- continue monitoring trends which help us to understand if market is growing, reducing, remaining stable, or experiencing seasonal fluctuations
- use data to estimate the impact of disruption of illegal websites
- encourage others with data to come forward and help refine and improve assumptions
- further explore other areas of the illegal gambling market – such as gambling within social media Apps and land-based gambling.
Annexes
Annex A - Summary of next steps to improve estimates
The following section outlines key information gaps and their impact on the reliability of estimates. Options for new sources of data and evidence are set out, alongside an assessment of the feasibility of the extent these options will satisfactorily fill these information gaps.
Options for improving ‘dwell-time‘ approach
More reliable estimates of gambling activities participated in on illegal websites
Effect on reliability: Medium.
New data source: Consumer research and surveys.
Consideration: Data from consumers who have used illegal websites can help us understand how activities participated in differ from behaviour in the legal market. Current data is based on Consumer Voice survey with relatively small sample size.
Feasibility: Medium - We will be asking this question in further stages of Consumer Voice research. This is unlikely to provide very large sample sizes -as recruiting consumers who are aware they have used illegal websites is challenging. But it will help strengthen existing survey data.
Data to allow betting expenditure to be included in the dwell-time approach
Effect on reliability: High.
New data source: Operators.
Consideration: Betting expenditure is less correlated with time on site and/or session length compared to slots or casino products. Data from regulated operators would help us to create a better proxy to improve ability to create a reliable estimate.
Feasibility: High - We expect that operators will be able to provide data that will help improve these estimates. This would only be needed from a sample of operators to improve assumptions that can be made with the data. Other challenges, however, need consideration – such as the extent this data is likely to reflect consumer behaviour in the illegal market. This is discussed later in this section.
Updating ‘Patterns of Play’ with more current data
Effect on reliability: High.
New data source: Operators.
Consideration: As Patterns of Play is several years old, current operator data could be used to verify and update estimates of expenditure per minute by product and explore if trends seen in market Insight data for slots are also seen in other gambling products.
Feasibility: High - As stated previously, operators are likely to be able to help us bring spend per minute calculations up to date. This would only require input from a sample of operators to update these assumptions.
Understanding of proportion of website visit time spent gambling – and how this varies between legal and illegal environments
Effect on reliability: Medium.
New data source: Consumer research and surveys.
Consideration: Understanding differences in latent time between illegal and legal environments will help us improve reliability of estimates.
Feasibility: Medium - We know that many consumers that use illegal sites are not aware if they are regulated or not. Therefore, ability to accurately report differences in behaviour might be limited. The more consumers report gambling experiences to be similar in both environments, however, would increase confidence that behaviour in legal environments could be generalised to illegal.
Options for improving ‘dwell-time‘ approach
Improving estimates of engagement with legal websites and Apps
Effect on reliability: High.
New data source: Operators.
Consideration: SimilarWeb estimates are associated with margins for error. Operators can help us verify the reliability of these estimates by sharing data on known consumer engagement with licensed websites and Apps.
Feasibility: High - We expect operators will be able to provide data that will help us verify reliability of Similarweb estimates by comparing these results with their own data on engagement with their platforms.
Options relevant to both approaches
Improved understanding of how expenditure differs between illegal and legal environments
Effect on reliability: High.
New data source: Consumer research and surveys.
Consideration: We know that consumers have different motivations which lead them to use illegal websites. We need to know more about how consumer expenditure varies between these environments – and for different groups of consumers.
Feasibility: Low - This is likely to be the greatest challenge. Consumers generally do not have good recall of gambling expenditure – and often do not understand if they were gambling in legal or illegal environments. Qualitative research will help us better understand how experiences differ – but it is unlikely we will be able to obtain robust data to draw strong conclusions on expenditure differences in each context.
Improving estimate of Virtual Private Network (VPN) use
Effect on reliability: High.
New data source: Consumer research and surveys. Exploring trends in VPN downloads and subscription fees in open banking data.
Consideration: Visits to illegal websites will be hidden by use of VPNs. We have seen a change in the amount of VPN downloads in recent months. We need to better understand the impact of this on the data we have collected. Our existing survey data is based on small samples sizes.
Feasibility: Medium - Additional survey data on this topic will be provided by Gambling Survey for Great Britain (GSGB) later this year. This will provide a larger sample size to improve our estimates.
Search terms used to identify illegal websites
Effect on reliability: High.
New data source: Consumer research and surveys.
Consideration: We need to maintain understanding of consumer motivations for using illegal sites so we can update and improve the list of search terms we use to identify illegal websites.
Feasibility: High - On-going consumer research – such as Consumer Voice – will allow us to maintain up to date search terms reflecting current consumer behaviour. Regular reviews will be used to ensure insights from the research are shared and applied to our list of search terms.
Annex B – Exploring motivations for accessing illegal gambling through estimates of search term volumes - Supplementary data
This annex is provided as supplementary information around motivations for engaging with illegal gambling. It is not directly linked to work to estimate the overall scale of this market.
In report 1, Illegal online gambling: Consumer awareness, drivers and motivations, we illustrated the wide range of consumer motivations for accessing illegal gambling websites. The key finding was that motivations are wide ranging. However, exploring which motivations are most prevalent is a significant challenge.
Through the development of this report, we have obtained data on illegal gambling websites by using search terms which reflect consumer motivations. Our approach to this is explained in more detail in Illegal online gambling: Consumer engagement and trends.
In the following table, we have provided data from SimilarWeb on the estimated volumes of searches made using these terms. These results should be seen as indicative only – but nonetheless provide an insight into which motivations might be most prevalent amongst consumers using these websites.
Our search terms have been grouped by theme. Data is set out in Annex B. Notable observations include:
- search terms related to ‘not on Gamstop’, or similar are estimated to have the highest volumes -suggesting that searches related to this motivation are made most frequently
- search terms related to the use of crypto assets were the next most frequently used: this suggests consumers are specifically searching for these opportunities which are not available in the legal market
- search terms related to ‘no identity verification’, ‘no age verification’ and international gambling opportunities did not have large enough search volumes for Similar web to provide an estimate: this suggests these terms are less frequently used by consumers compared to searches related to ‘not-on-Gamstop’ or crypto gambling.
These results are indicative only. It should be noted that search engines are only one route to accessing illegal sites. More work is needed to explore the accuracy of these estimates and whether motivations reflected in search term volumes are changing over time
Annex B - Search term volume by SimilarWeb estimate
| Search term | Theme | Volume estimate |
|---|---|---|
| Non gamstop casinos | Not on gamstop | 6,420 |
| Casinos not on Gamstop | Not on gamstop | 5,640 |
| Non gamstop casino | Not on gamstop | 3,310 |
| Crypto casino | Crypto | 1,220 |
| Crypto gambling | Crypto | 840 |
| Crypto gambling sites | Crypto | 670 |
| Crypto gambling sites | Sites not on gamstop | 480 |
| Crypto gambling sites | Sites not on gamstop | 480 |
| Non gamstop betting sites | Sites not on gamstop | 340 |
| Non gamstop betting sites | Crypto | 280 |
| Casino not on gamstop | Not on Gamstop | 270 |
| Crypto betting | Crypto | 270 |
| Non gamstop sites | Not on Gamstop | 0 |
| Non gamstop slots | Not on Gamstop | 0 |
| Slots not on gamstop | Not on Gamstop | 0 |
| Non gamstop uk | Not on Gamstop | No data |
| Non gamstop betting | Not on Gamstop | No data |
| Non gamstop uk sites | Not on Gamstop | No data |
| Non gamstop casino sites | Not on Gamstop | No data |
| Betting not on gamstop | Not on Gamstop | No data |
| Non gamban casinos | Not on Gamstop | No data |
| No verification casinos | Not on Gamstop | No data |
| No verification casinos | No identity checks | No data |
| No kyc casinos | No identity checks | No data |
| Best casinos no limits | No identity checks | No data |
| Best gambling sites without affordability checks | No identity checks | No data |
| Betting sites with no affordability checks | No identity checks | No data |
| Betting sites without affordability checks | No identity checks | No data |
| Gambling sites with no affordability checks | No identity checks | No data |
| Gambling sites without financial checks | No identity checks | No data |
| No affordability checks casino uk | No identity checks | No data |
| No financial assessment gambling | No identity checks | No data |
| No financial checks gambling uk | No identity checks | No data |
| No income check betting sites | No identity checks | No data |
| UK gambling sites no checks | No identity checks | No data |
| Best foreign casinos | International | No data |
| Best international casinos | International | No data |
| Bitcoin casino | Crypto | No data |
| Btc casino | Crypto | No data |
| Btc casino | Crypto | No data |
| Gambling sites without age verification | No age checks | No data |
| No age verification gambling | No age checks | No data |
| Online casinos no age check | No age checks | No data |
| No age check betting | No age checks | No data |
| No age limit gambling | No age checks | No data |
Data collected for August 2025. Source : SimilarWeb
A search volume of 0 indicates the search term is included in SimilarWeb's database, but estimated search volumes were extremely low, likely below the threshold of what SimilarWeb considers statistically significant. ‘No data’ indicates the term was not included in SimilarWeb’s database for the selected time period, either because it was too obscure, too new, or SimilarWeb did not have enough data to generate an estimate.