Report
Gambling participation and the prevalence of problem gambling survey: Experimental statistics stage
Gambling Commission report produced by NatCen on the experimental statistics stage of the gambling participation and the prevalence of problem gambling survey.
The impact of gambling on spending
Figure 8: The impact of gambling on spending
Young people who actively gambled in the last 12 months were asked if their own gambling had stopped them buying things that they wanted or, conversely, helped them to buy things that they needed.
Reflecting the perceived impact on households of family members gambling, as discussed in the next section, young people were most likely to highlight that gambling had helped them to buy things that they needed either all of the time, often or sometimes (10 percent). They were less likely to say that their own gambling stopped them from buying things that they wanted (5 percent).
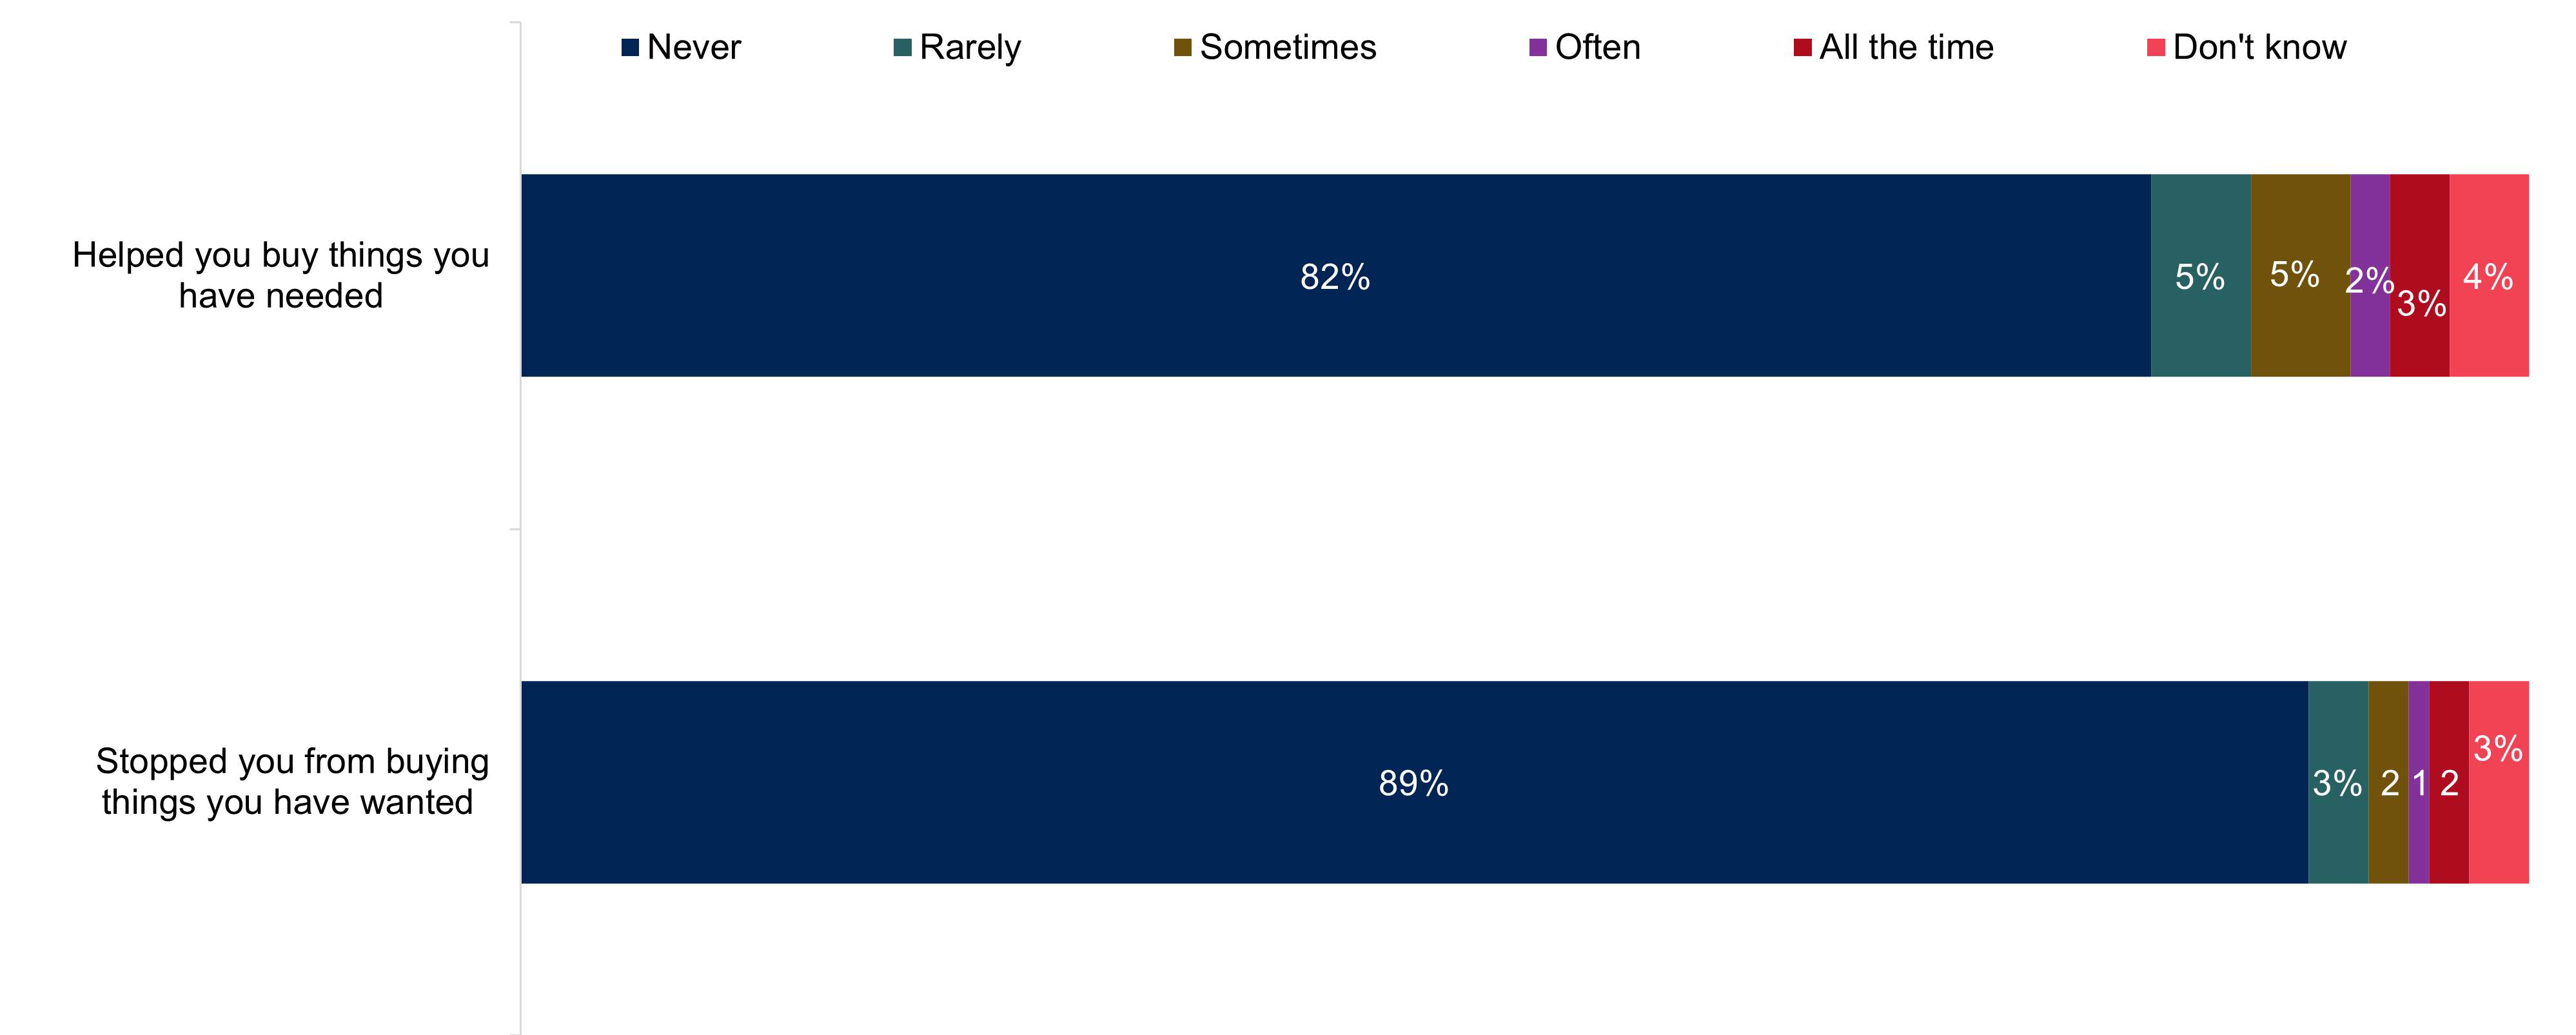
Figure 8 information
GC_GAMBSTBUY GC_GAMBHPBUY. Thinking about the last 12 months, how often, if at all, has your own gambling led to any of the following things?
Base: All 11 to 17 year olds answering who have spent their own money gambling in the last 12 months 'Stopped you from buying things you have want' (850). 'Helped you buy things you have needed' (850).
| The impact of gambling on spending | Percentage who never | Percentage who rarely | Percentage who sometimes | Percentage who often | Percentage who all the time | Percentage who don't know |
|---|---|---|---|---|---|---|
| Helped you buy things you have needed | 82% | 5% | 5% | 2% | 3% | 4% |
| Stopped you from buying things you have wanted | 89% | 3% | 2% | 1% | 2% | 3% |
Those in the ‘at risk’ group were more likely than ‘non-problem’ gamblers to say that their own gambling stopped them from buying things that they wanted (24 percent compared to 2 percent) and that gambling had helped them to buy the things that they needed (36 percent compared to 7 percent).
Girls were more likely than boys to say that gambling had never helped them to buy the things that they needed (86 percent compared to 78 percent). This pattern was not seen last year. This is because, while the proportion for boys has remained constant, for girls the proportion has increased (from 80 percent in 2022).
Last updated: 16 November 2023
Show updates to this content
No changes to show.