Strategy
National Strategic Assessment 2020
This report sets out our latest assessment of the issues we face and the risks that gambling poses to consumers and the public
What did we see in phase 2?
Phase 2 has been characterised by levels of spend higher than pre-lockdown levels, driven by the pent-up demand for sports betting on popular events. Online real event betting GGY rose by 115% between May and June, with the number of active players up by 81%. This was driven by the return of top-flight football and leveraged by a combination of betting-friendly characteristics (staggered KO times, TV coverage including free-to-air coverage and a high volume of games). GGY has still not returned to pre-lockdown levels (10% over).
Since we issued additional guidance to operators, operator data also shows that the number of online slots sessions lasting longer than an hour decreased in July (from 2,327,818 in May to 2,181,919).
Average session length has also decreased by 1 minute in this time. Between May and July, the number of customer interactions undertaken rose by 14% (from 760,480 to 866,053). Within that number the majority were automated in nature.
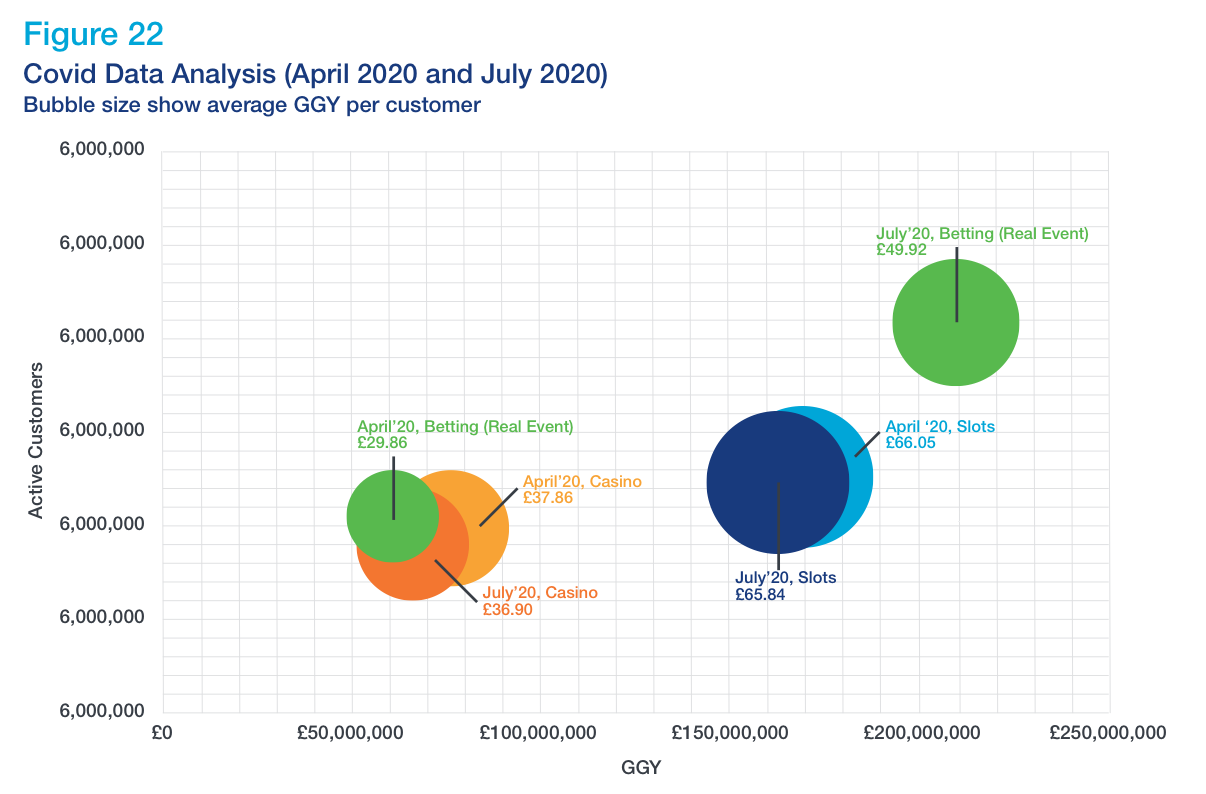
Recent consumer research has allowed us to measure the impact of the coronavirus (COVID-19) period on both those who gambled before lockdown49 and those who did not, including channel and product shifts and whether these have been maintained. Figure 22 summarises behaviour change during and post lockdown and provides population level percentages for where behaviour has changed.
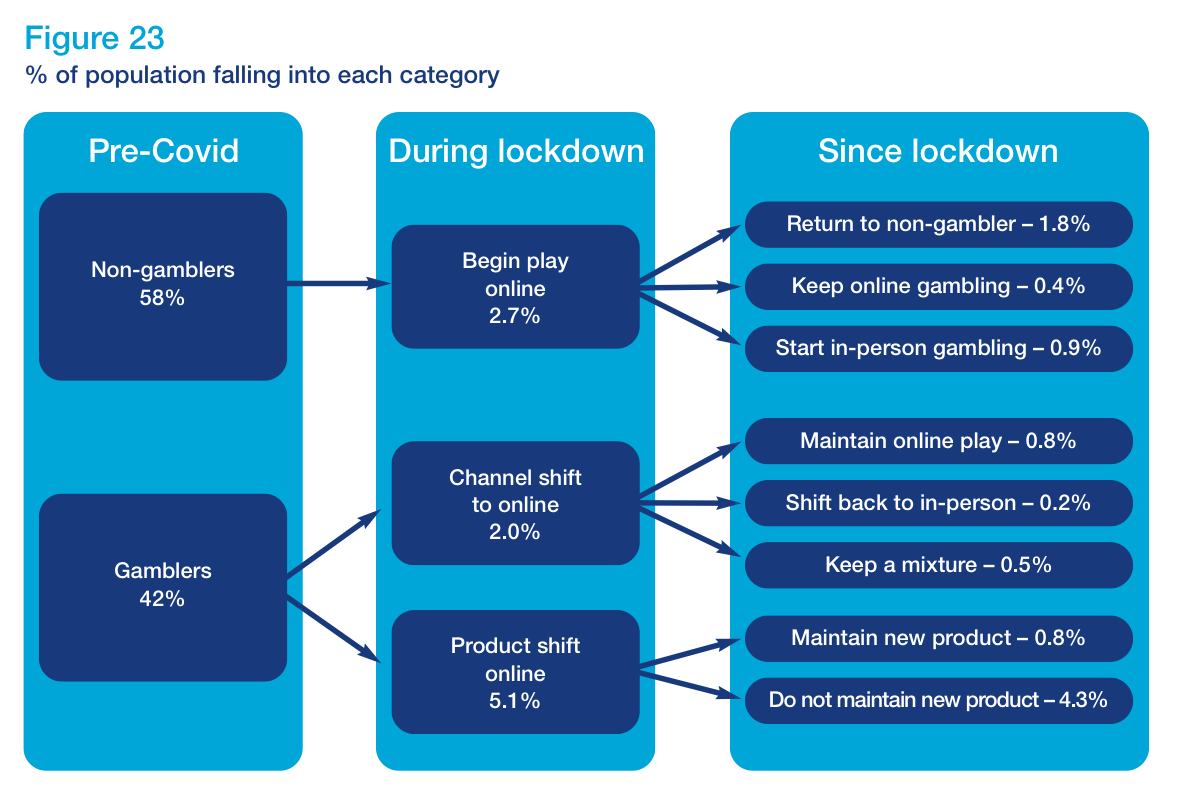
Looking back at the impact of lockdown, the survey shows that at a population level, relatively few people changed their gambling participation during lockdown, although there were elements of shifting to online products in the absence of land-based opportunities. Some of these new behaviours are currently being maintained post-lockdown.
References
49 This period was from January 2020 to the start of lockdown.
What action did we take in phase 1 Next section
Current phase and looking ahead
Last updated: 25 July 2024
Show updates to this content
Formatting changes only.