Report
Insights into affected others from the GSGB
Insights into affected others from the GSGB
Further exploration of affected others who gamble and those who do not
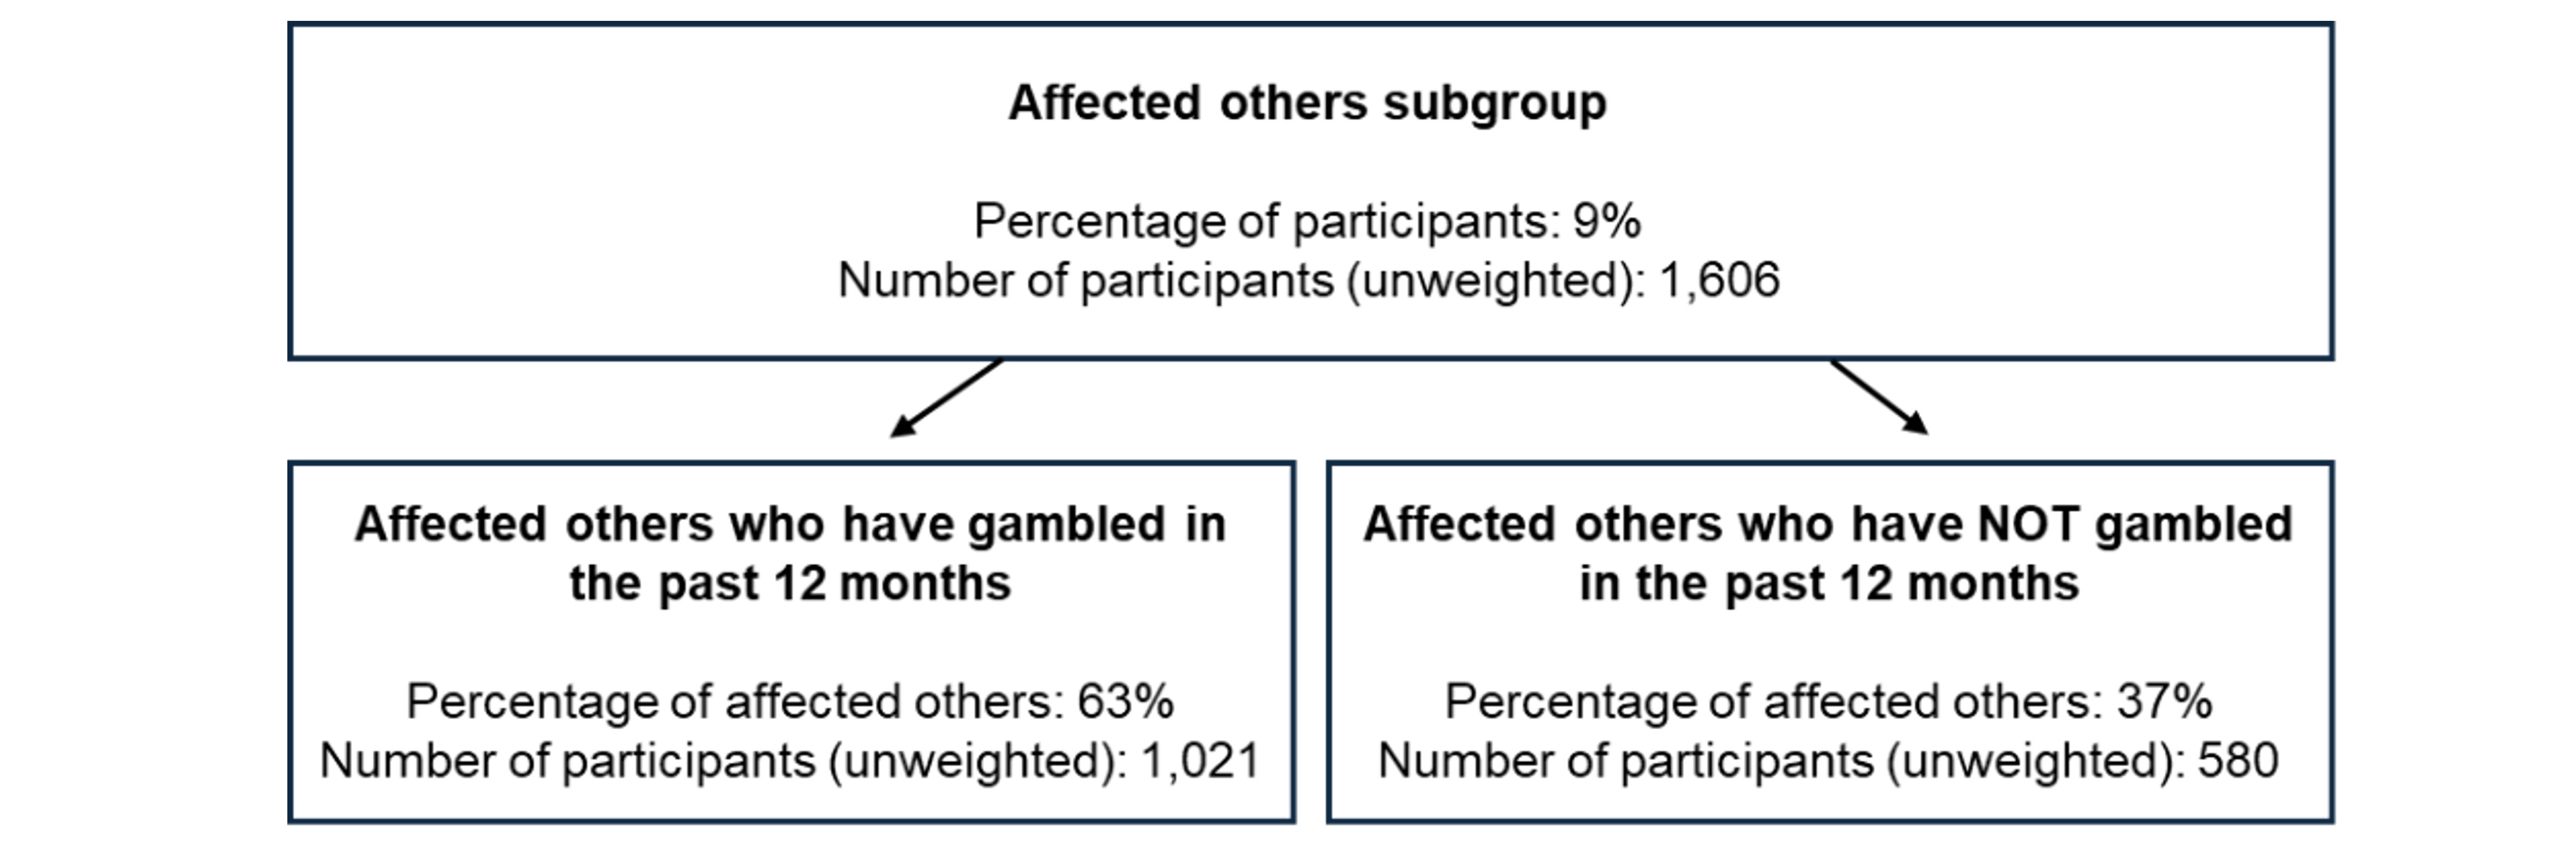
Given that many affected others were gambling themselves, we explored the demographics of affected others who gamble and those who do not, to identify any differences between these groups. Affected others were grouped into those who had gambled in the past 12 months (63 percent) and those who had not (37 percent), as shown in Figure 2.
Figure 2 - Proportion of affected others who do and do not gamble themselves
| Definition | Percentage | Number of participants |
|---|---|---|
| Affected others subgroup | 9% of total participants | 1,606 |
| Affected others who have gambled in the past 12 months | 63% of affected others | 1,021 |
| Affected others who have not gambled in the past 12 months | 37% of affected others | 580 |
Note: Base sizes do not sum to total number of affected others due to participants not responding to participation questions.
Where relevant, we also examined gambling behaviour among affected others who gambled, including types of gambling activities, reasons for gambling, and level of gambling risk, as measured by the Problem Gambling Severity Index (PGSI).
Demographic profiles
Similar to the overall group of people affected by someone else’s gambling, affected others that had gambled themselves in the past 12 months were more likely to be female (53 percent compared with 47 percent male). They were also more likely to be aged between 25 to 34 years (26 percent).
Among all participants who had gambled in the past 12 months, the proportion of males and females that gambled was similar (50 percent for each). Participants who gambled were more likely to be aged between 25 to 64 (ranging between 16 and 17 percent).
Within the affected others group, those who had gambled in the past 12 months were more likely to be male than those who had not (47 percent male versus 41 percent who did not). This pattern mirrors sex differences observed among all Gambling Survey for Great Britain (GSGB) participants, where adults who had gambled in the past 12 months were more likely to be male than those who had not (50 percent versus 45 percent). Taking into account the higher overall proportion of females among affected others relative to the GSGB sample, the greater representation of males among affected others who gambled is consistent with expectations. There is no increased propensity for male affected others to gamble compared to males overall.
The age profiles of affected others who did and did not gamble in the past 12 months were broadly similar across most age groups. The exception was those aged 18 to 24 years, who were more likely to report not participate in gambling.
Table 3 - Demographic profiles of affected others who did and did not gamble in the past 12 months5
| Sex | All affected others (percentage) | Affected others who have gambled in the past 12 months (percentage) | Affected others who have not gambled in the past 12 months (percentage) |
|---|---|---|---|
| Male | 45% | 47% | 41% |
| Female | 55% | 53% | 59% |
| Age | All affected others (percentage) | Affected others who have gambled in the past 12 months (percentage) | Affected others who have not gambled in the past 12 months (percentage) |
| 18 to 24 | 15% | 14% | 18% |
| 25 to 34 | 25% | 26% | 24% |
| 35 to 44 | 21% | 21% | 21% |
| 45 to 54 | 14% | 15% | 14% |
| 55 to 64 | 13% | 13% | 12% |
| 65 to 74 | 9% | 8% | 9% |
| 75 and over | 3% | 3% | 3% |
Participation in types of gambling activities
Participations rates for all gambling activities were higher amongst affected others who gambled in the past 12 months compared to all GSGB participants who had gambled in the past 12 months. The only exception was National Lottery draws where their participation was lower. Participation in charity lotteries were similar between the 2 groups.
The participation rates increased the most for betting on the outcome of events in person (3.7 times higher) and online (2.6 times higher) and playing casino games at a casino (2.7 times higher), compared with all participants who gambled. These differences are shown in Table 4.
Table 4 - Gambling participation rates for specific gambling activities in the past 12 months, for those affected by someone else’s gambling who gamble themselves, compared to rates for all people who gamble.
| Type of gambling | Affected others who have gambled in the past 12 months (percentage) | All GSGB participants who have gambled in the past 12 months (percentage) | Factor increase in participation (for affected others who gamble)6 |
|---|---|---|---|
| National Lottery draws | 60.1% | 65.0% | 0.93 |
| National Lottery scratchcards | 43.0% | 30.7% | 1.40 |
| Charity lottery draws | 35.0% | 34.2% | Non-significant difference | Betting on sports or racing online | 31.7% | 22.9% | 1.39 | Private betting | 25.3% | 13.1% | 1.93 | Fruit and/or slots machines played in person | 20.1% | 10.3% | 1.96 | National Lottery online instant win games | 19.4% | 13.8% | 1.40 | Non-National Lottery online instant win games | 17.8% | 7.6% | 2.36 | Bingo played at a venue | 17.5% | 10.0% | 1.75 | Betting on sports and racing in person | 17.2% | 10.2% | 1.69 | Non-National Lottery scratchcards | 15.9% | 8.7% | 1.82 | Fruit and/or slots machines played online | 15.8% | 7.5% | 2.09 | Casino games played online | 15.6% | 7.7% | 2.04 | Football pools | 13.0% | 5.4% | 2.42 | Betting on the outcome of events online | 11.6% | 4.5% | 2.58 | Casino games played at a casino | 11.5% | 4.3% | 2.66 | Bingo played online | 11.5% | 5.8% | 1.97 | Casino games played on a machine and/or terminal in a venue | 11.4% | 4.6% | 2.49 | Betting on the outcome of events in person | 7.7% | 2.1% | 3.70 |
Reasons for gambling
Participants who had gambled in the past 12 months were asked about 15 different reasons for gambling and how often each reason applied to them.
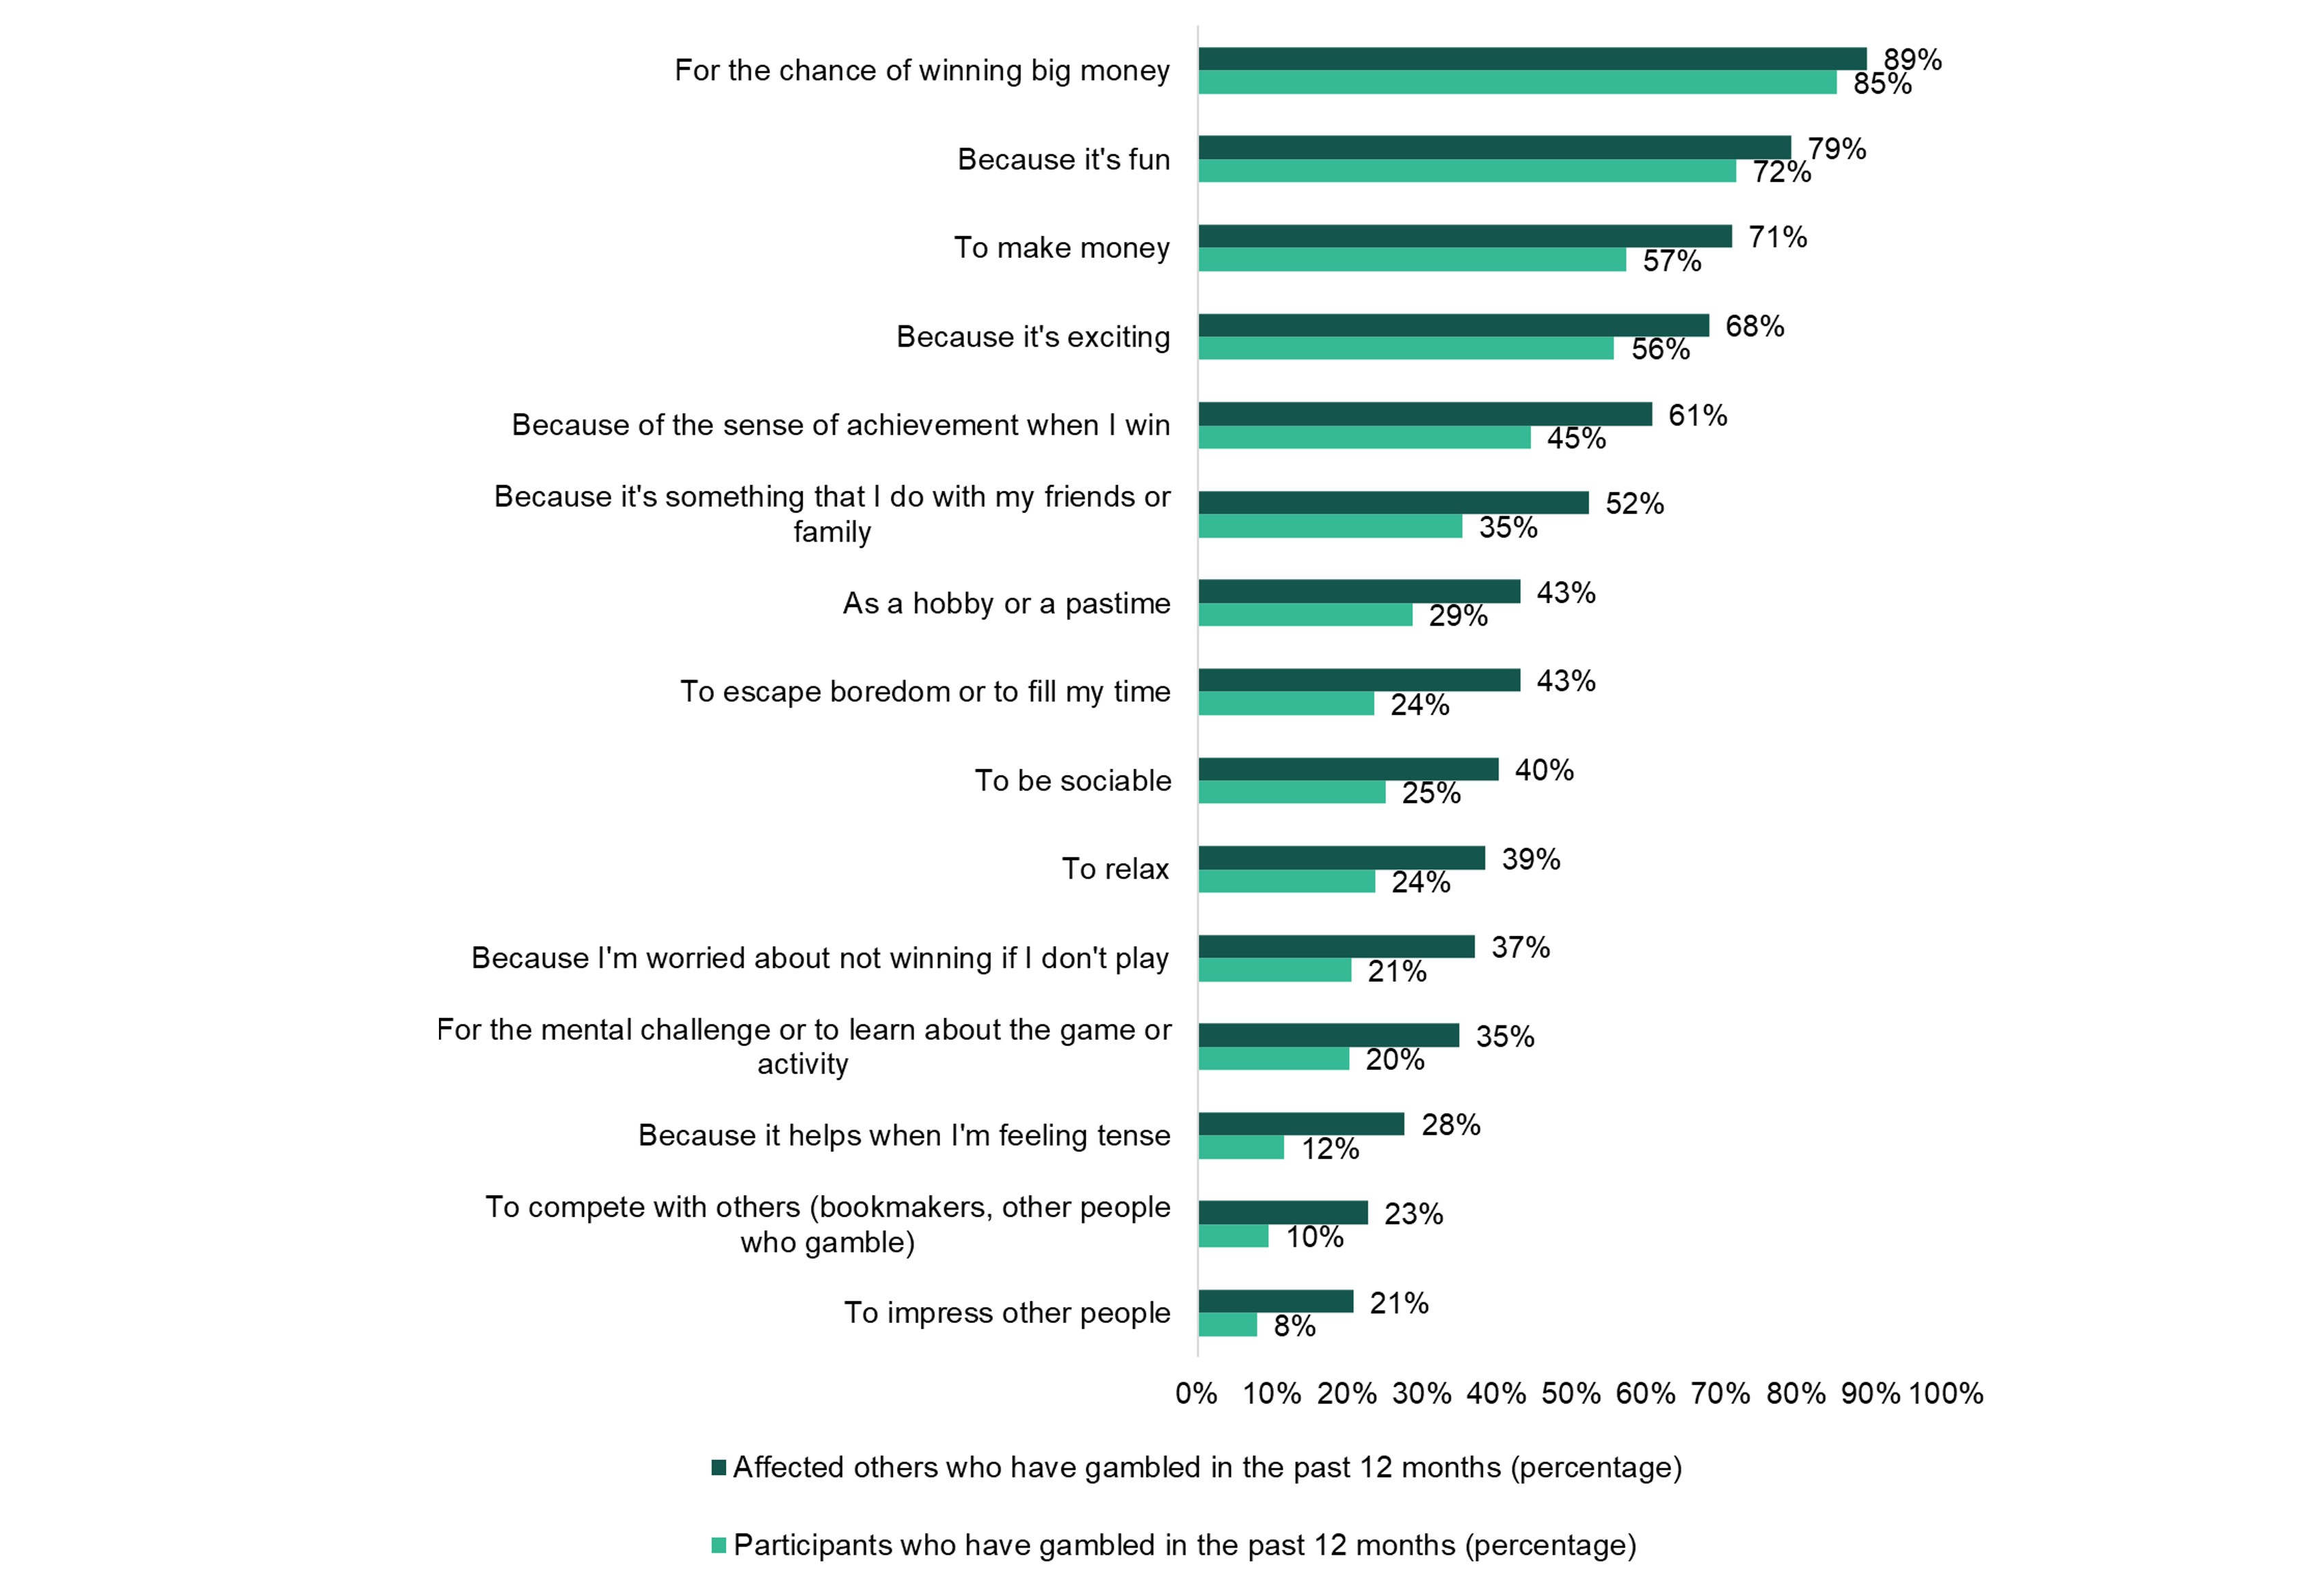
When comparing affected others who gambled with participants who gambled in the past 12 months, the top 3 most reported reasons (at least sometimes) were similar across both groups. These were gambling for the chance of winning money (89 percent versus 85 percent), because it’s fun (79 percent versus 72 percent), and to make money (71 percent versus 57 percent).
Across all reasons, a higher proportion of affected others who gambled reported gambling for each reason (at least sometimes), compared with participants who gambled in the past 12 months. In particular, ‘to escape boredom or to fill my time’ and ‘because it’s something that I do with my friends or family’ had the biggest differences, as shown in Figure 3.
Figure 3 - Reasons for gambling in the past 12 months for those affected by someone else’s gambling who gamble themselves, compared to rates for all people who gamble
| Reason for gambling | Affected others who have gambled in the past 12 months (percentage) | Participants who have gambled in the past 12 months (percentage) |
|---|---|---|
| For the chance of winning big money | 89% | 85% |
| Because it’s fun | 79% | 72% |
| To make money | 71% | 57% |
| Because it’s exciting | 68% | 56% |
| Because of the sense of achievement when I win | 61% | 45% |
| Because it’s something that I do with friends or family | 52% | 35% |
| As a hobby or pastime | 43% | 29% |
| To escape boredom or to fill my time | 43% | 24% |
| To be sociable | 40% | 25% |
| To relax | 39% | 24% |
| Because I’m worried about not winning if I don’t play | 37% | 21% |
| For the mental challenge or to learn about the game or activity | 35% | 20% |
| Because it helps when I’m feeling tense | 28% | 12% |
| To compete with others (bookmakers, other people who gamble) | 23% | 10% |
| To impress other people | 21% | 8% |
Problem Gambling Severity Index (PGSI)
Affected others who reported gambling themselves were more likely to score higher on the Problem Gambling Severity Index (PGSI) than for all those who gambled in the past 12 months. Specifically, they were 4.8 times more likely to score at least 8 compared to all participants who gamble, as shown in Table 5, where a score of 8 to 27 is represents experiences of problem gambling behaviour.
Table 5 - Grouped Problem Gambling Severity Index (PGSI) scores of those who have gambled in the past 12 months
| PGSI score | Affected others who have gambled in the past 12 months (percentage) | Participants who have gambled in the past 12 months (percentage) |
|---|---|---|
| 0 | 46.5% | 75.5% |
| 1 to 2 | 18.4% | 14.8% |
| 3 to 7 | 13.6% | 5.3% |
| 8 to 27 | 21.5% | 4.5% |
References
5 Within sex and age breakdowns, percentages may not sum to 100 percent due to rounding.
6 This factor describes how many times larger the participation rate for affected others (who have gambled in the past 12 months) is compared to the participation rate for all GSGB participants who have gambled in the past 12 months). A factor of less than 1 indicates that the participation rate for affected others is lower than for those who gambled in the past 12 months. Factors are not given for activities where there is not a statistically significant difference in rates between the two groups (when accounting for the size of the groups, the participation rates are similar to be considered equivalent).
Prevalence and characteristics of affected others Next section
Adverse consequences experienced as an affected other
Last updated: 14 May 2026
Show updates to this content
No changes to show.