Statistics and research release
Gambling behaviour in 2020: Findings from the quarterly telephone survey: Official statistics
Statistics on participation and problem gambling year to December 2020.
Summary
Also published recently
- Gambling participation and the prevalence of problem gambling survey: Final experimental statistics stage (Step 3)
- Statistics on participation and problem gambling for the year to March 2023: Official statistics
- Gambling participation and the prevalence of problem gambling survey: Experimental statistics stage
The Gambling Survey for Great Britain (GSGB) now gathers the latest data on gambling behaviours.
This statistical release covers the quarterly gambling participation and problem gambling prevalence data for the year to December 2020, as well as reporting on respondents’ perceptions of trust, crime, and attitudes towards gambling.
The year to December 2020, which the data is based upon and reflects, has been an unique year; with the arrival of coronavirus (COVID-19). The various lockdown rules and restrictions throughout 2020 have brought about significant consumer behavioural change and clearly have also had a major impact on the gambling industry.
The data being released today is based on the Gambling Commission’s quarterly telephone survey conducted by Yonder Consulting. A nationally representative sample of 4,007 adults aged 16 and over were interviewed via telephone in March, June, September and December 2020. Approximately one-quarter of the data was collected before any national restrictions came into force in Great Britain (pre-March 23rd 2020) and approximately three-quarters of the data was collected during periods of restricted activity later in 2020. Further details on the quarterly telephone survey methodology can be found on the front cover of the main publication.
Key facts
- Overall participation in any gambling activity in the last four weeks has fallen to 42% (a 5 percentage point decline compared to the previous year).
- Online gambling participation is up to 24% (an increase of 3 percentage points), whilst in person participation is down 9 percentage points to 26%.
- National Lottery draws and other lotteries have seen increases in online play and decreases in in person play.
- In other activities, there have been decreases in participation in in-person football pools, bingo, betting on horse races, betting on other events and casino games.
- The overall problem gambling rate is 0.3%, compared to 0.6% the previous year, although this decrease is not a statistically significant decrease on the previous year's figures 1.
- The moderate risk rate is statistically stable (0.9%), whilst the low risk rate has shown a significant decrease from 2.7% to 2.0%.
- Levels of agreement that gambling is conducted fairly and can be trusted have remained stable at 29%.
Details
Overall gambling participation
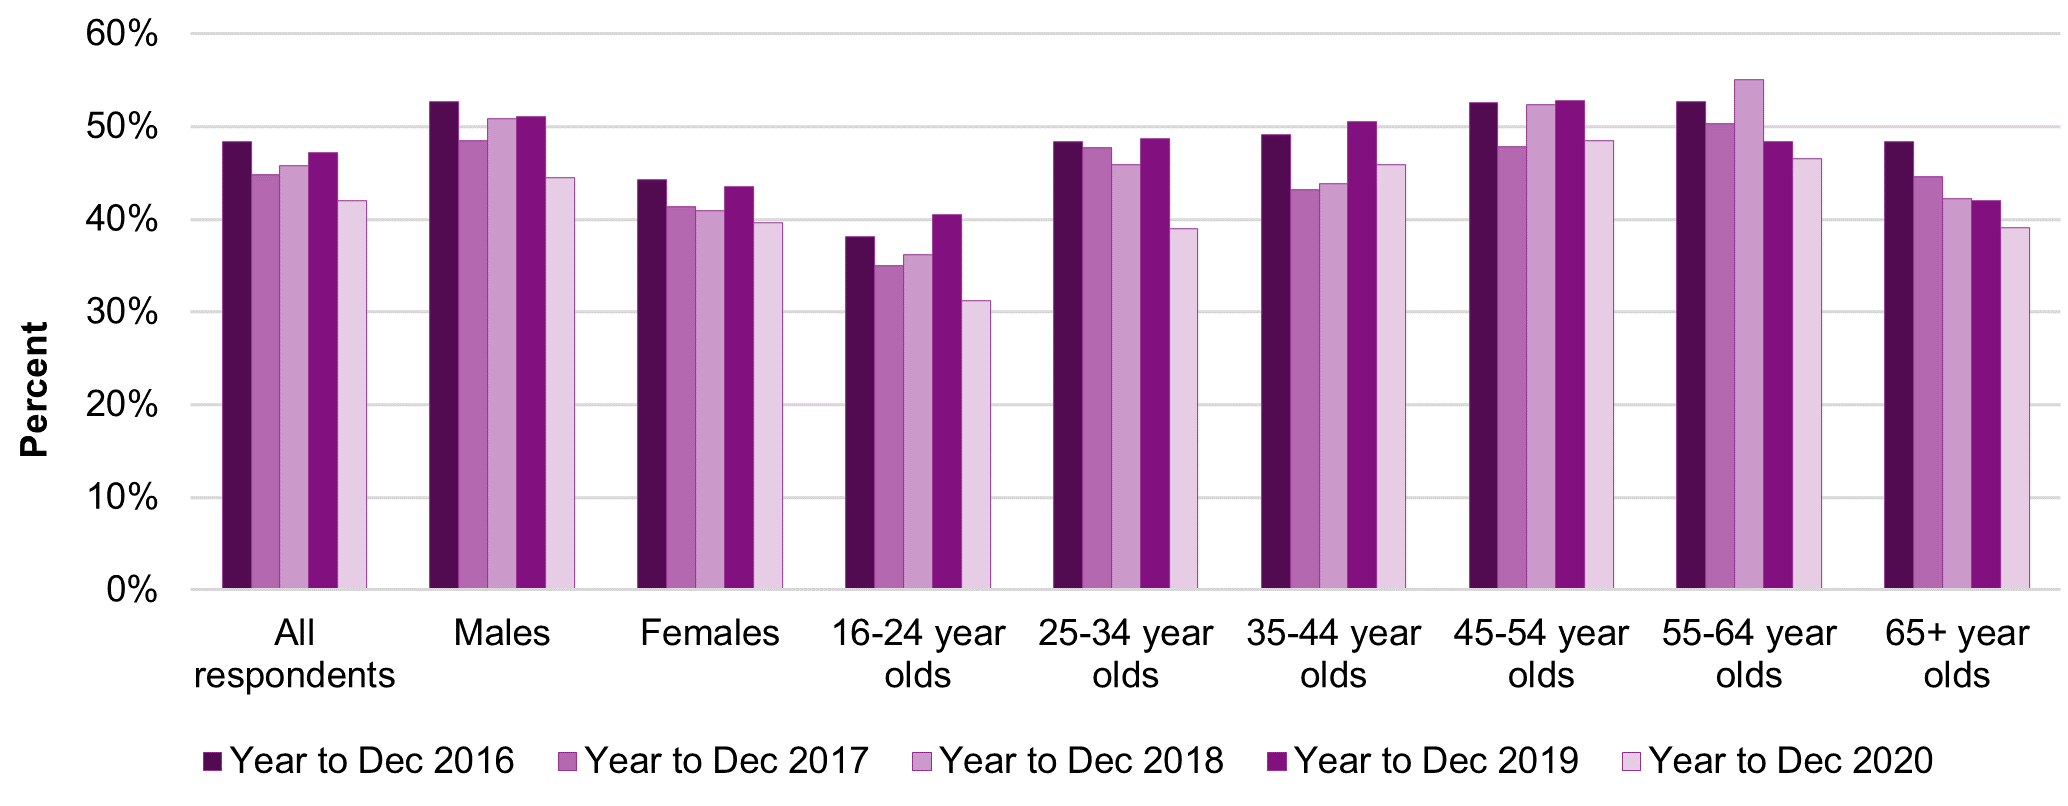
Overall, 42% of adults (16+) said they had participated in at least one form of gambling in the previous four weeks, representing a significant decline from the previous year (47% in 2019). A larger proportion of men (45%) had participated in any form of gambling as had those aged 35-44 (46%), 45-54 (48%) and 55-64 (47%). Similar to the previous year, those in the youngest age group (16-24) had the lowest level of gambling participation (31%). Between 2019 and 2020, each gender and age category (shown below) show some level of decline in participation rates, albeit not all are statistically significant at the 95% level.
Figure 1 - Proportion of respondents participating in at least one form of gambling in the past four weeks, by gender and age
| % | All respondents | Males | Females | 16-24 year olds | 25-34 year olds | 35-44 year olds | 45-54 year olds | 55-64 year olds | 65+ year olds |
|---|---|---|---|---|---|---|---|---|---|
| Year to Dec 2016 | 48.4 | 52.6 | 44.3 | 38.1 | 48.3 | 49.2 | 52.6 | 52.7 | 48.4 |
| Year to Dec 2017 | 44.8 | 48.4 | 41.4 | 35.0 | 47.7 | 43.2 | 47.8 | 50.3 | 44.6 |
| Year to Dec 2018 | 45.8 | 50.8 | 40.9 | 36.1 | 45.9 | 43.9 | 52.3 | 55.0 | 42.2 |
| Year to Dec 2019 | 47.2 | 51.0 | 43.5 | 40.4 | 48.7 | 50.5 | 52.8 | 48.4 | 41.9 |
| Year to Dec 2020 | 42.0 | 44.5 | 39.6 | 31.2 | 39.0 | 45.8 | 48.4 | 46.5 | 39.1 |
| Significant 2019 to 2020 | Yes | Yes | Yes | Yes | Yes |
(Yes = Statistically significant change from Year to December 2019 at the 95% level)
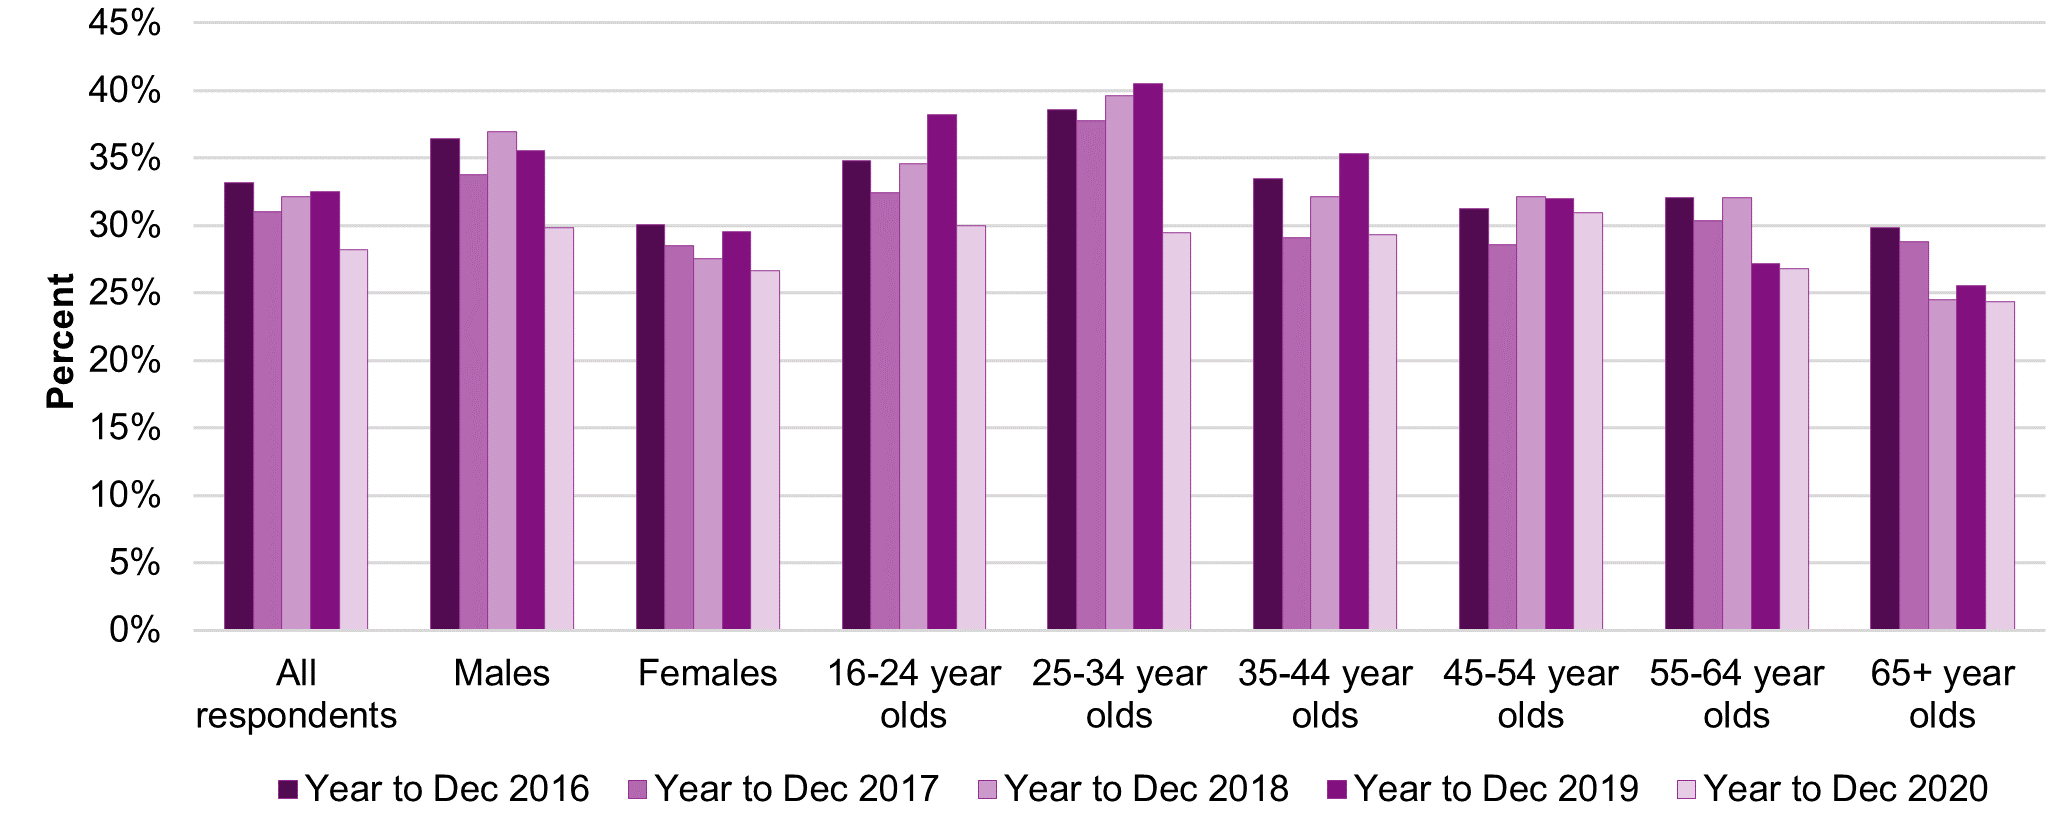
As participation in National Lottery draws is so much higher than for other gambling, changes in National Lottery participation can have a noticeable impact on overall participation rates. It is therefore useful to remove the responses of those who have only participated in National Lottery draws to highlight patterns across age and gender groups. When respondents who have only taken part in National Lottery draws are excluded, the overall participation rate falls significantly from 32% in 2019 to 28% in 2020.
Figure 2 - Proportion of respondents participating in at least one form of gambling in the past four weeks excluding those only playing National Lottery draw products, by gender and age
| % | All respondents | Males | Females | 16-24 year olds | 25-34 year olds | 35-44 year olds | 45-54 year olds | 55-64 year olds | 65+ year olds |
|---|---|---|---|---|---|---|---|---|---|
| Year to Dec 2016 | 33.2 | 36.5 | 30.1 | 34.8 | 38.6 | 33.5 | 31.3 | 32.0 | 29.9 |
| Year to Dec 2017 | 31.1 | 33.7 | 28.5 | 32.4 | 37.8 | 29.1 | 28.6 | 30.4 | 28.8 |
| Year to Dec 2018 | 32.1 | 36.9 | 27.5 | 34.6 | 39.6 | 32.2 | 32.1 | 32.0 | 24.5 |
| Year to Dec 2019 | 32.5 | 35.6 | 29.5 | 38.2 | 40.5 | 35.3 | 32.0 | 27.2 | 25.5 |
| Year to Dec 2020 | 28.2 | 29.8 | 26.7 | 30.0 | 29.5 | 29.3 | 31.0 | 26.8 | 24.4 |
| Significant 2019 to 2020 | Yes | Yes | Yes | Yes | Yes | Yes |
In 2020, participation in many activities decreased, with many in person activities not being available for a large proportion of the year due to coronavirus. The most popular gambling activities remained National Lottery draws (27%), followed by other lotteries (12%) and scratchcards (8%).
In-person gambling participation
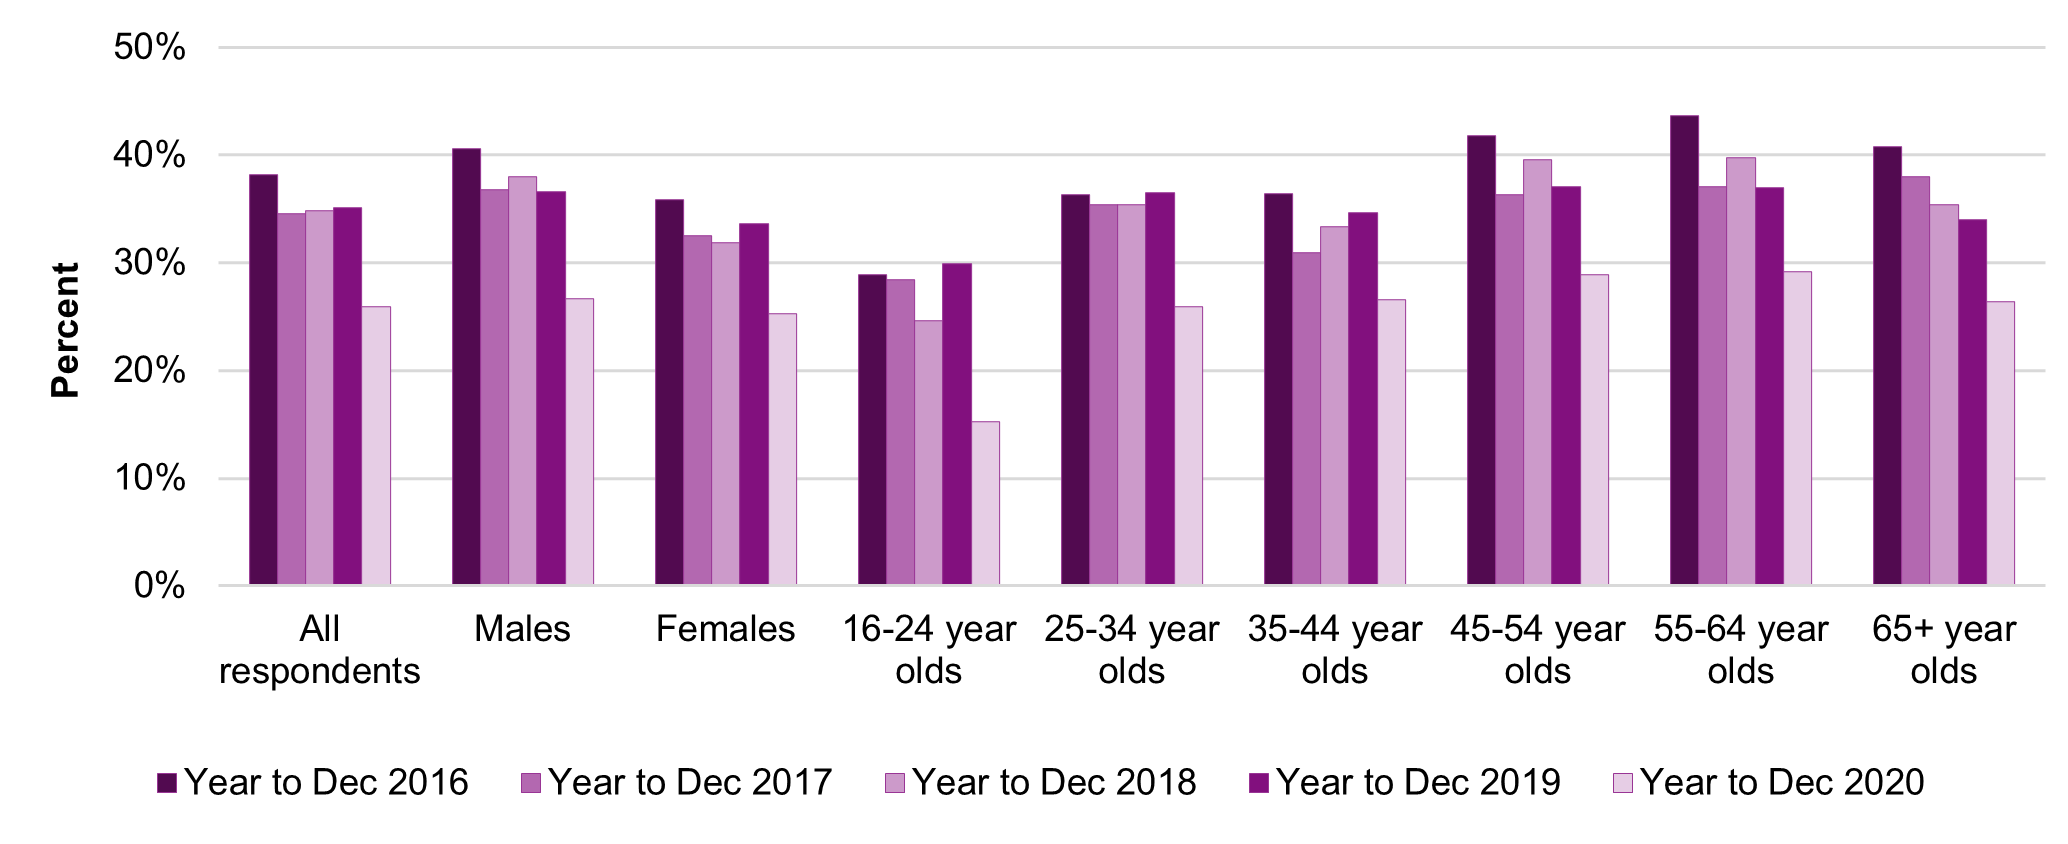
In-person gambling activities have been severely affected since the beginning of the coronavirus pandemic. In March 2020 for example, all retail gambling venues closed. Data shows that in year to December 2020, 26% of adults had gambled in person in the previous four weeks, a significant decrease (9 percentage points) since 2019. This significant reduction in in person gambling spans each age group and gender as shown in figure 3.
Decreases in in-person gambling have been seen mainly in National Lottery draws, other lotteries, football pools, bingo, betting on horse races, betting on other events and casino games.
Figure 3 - Proportion of respondents participating in at least one form of in person gambling in the past four weeks, by gender and age
| % | All respondents | Males | Females | 16-24 year olds | 25-34 year olds | 35-44 year olds | 45-54 year olds | 55-64 year olds | 65+ year olds |
|---|---|---|---|---|---|---|---|---|---|
| Year to Dec 2016 | 38.2 | 40.6 | 35.8 | 28.9 | 36.4 | 36.4 | 41.8 | 43.6 | 40.7 |
| Year to Dec 2017 | 34.6 | 36.8 | 32.5 | 28.4 | 35.4 | 30.9 | 36.3 | 37.1 | 38.0 |
| Year to Dec 2018 | 34.8 | 38.0 | 31.9 | 24.6 | 35.4 | 33.4 | 39.6 | 39.7 | 35.4 |
| Year to Dec 2019 | 35.1 | 36.6 | 33.6 | 29.9 | 36.5 | 34.6 | 37.1 | 37.0 | 34.0 |
| Year to Dec 2020 | 26.0 | 26.7 | 25.3 | 15.2 | 25.9 | 26.6 | 28.9 | 29.1 | 26.4 |
| Significant 2019 to 2020 | Yes | Yes | Yes | Yes | Yes | Yes | Yes | Yes | Yes |
Online gambling participation
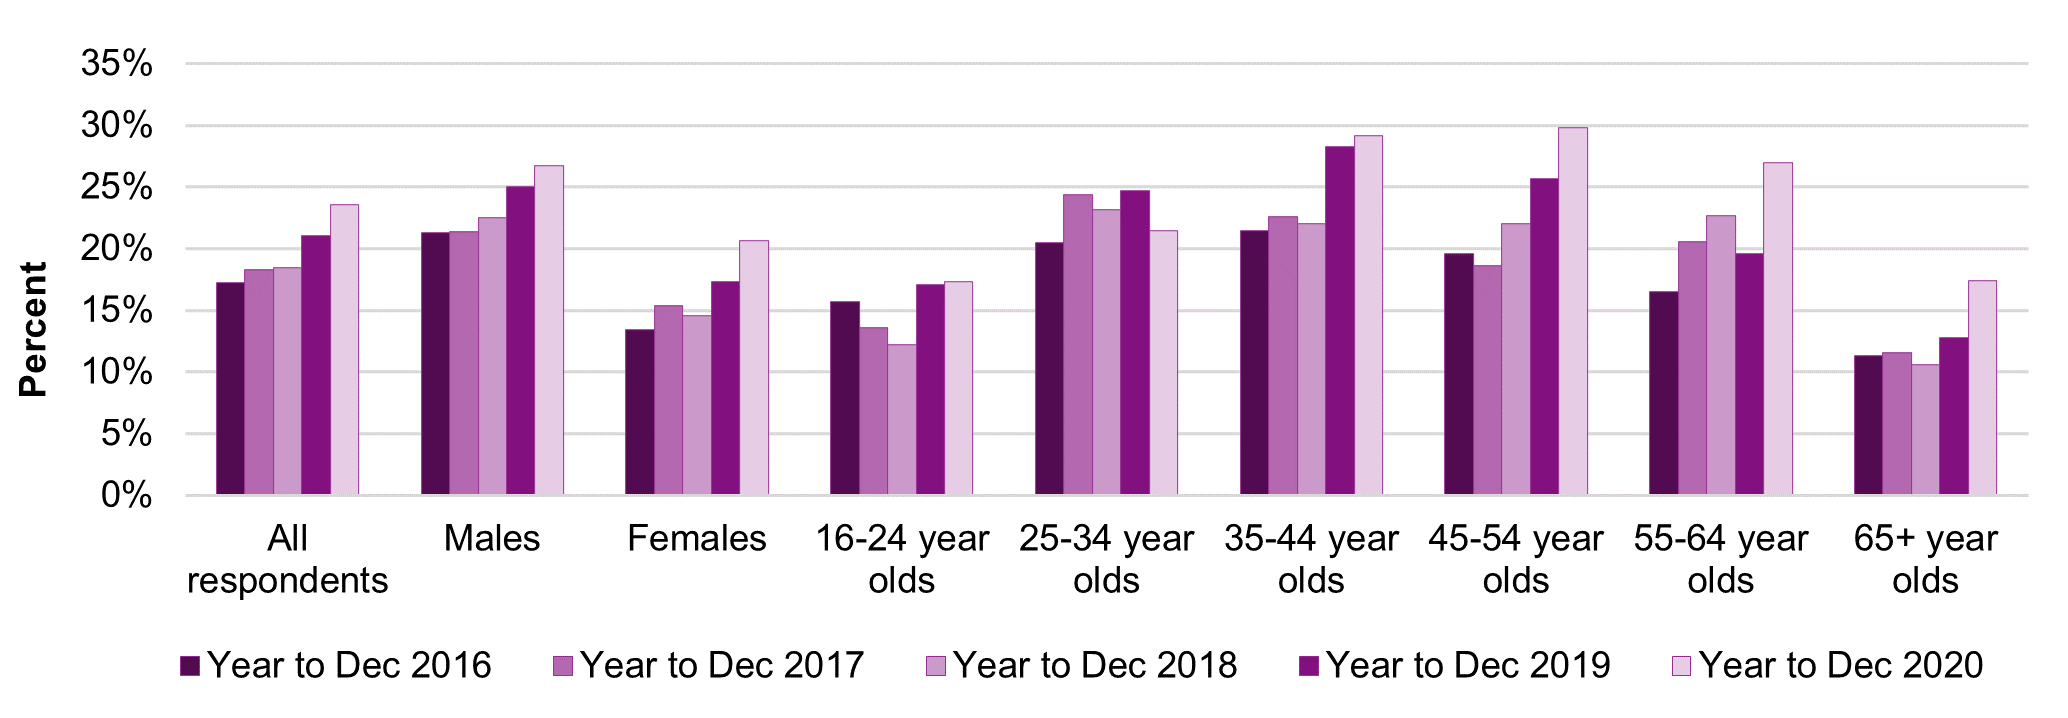
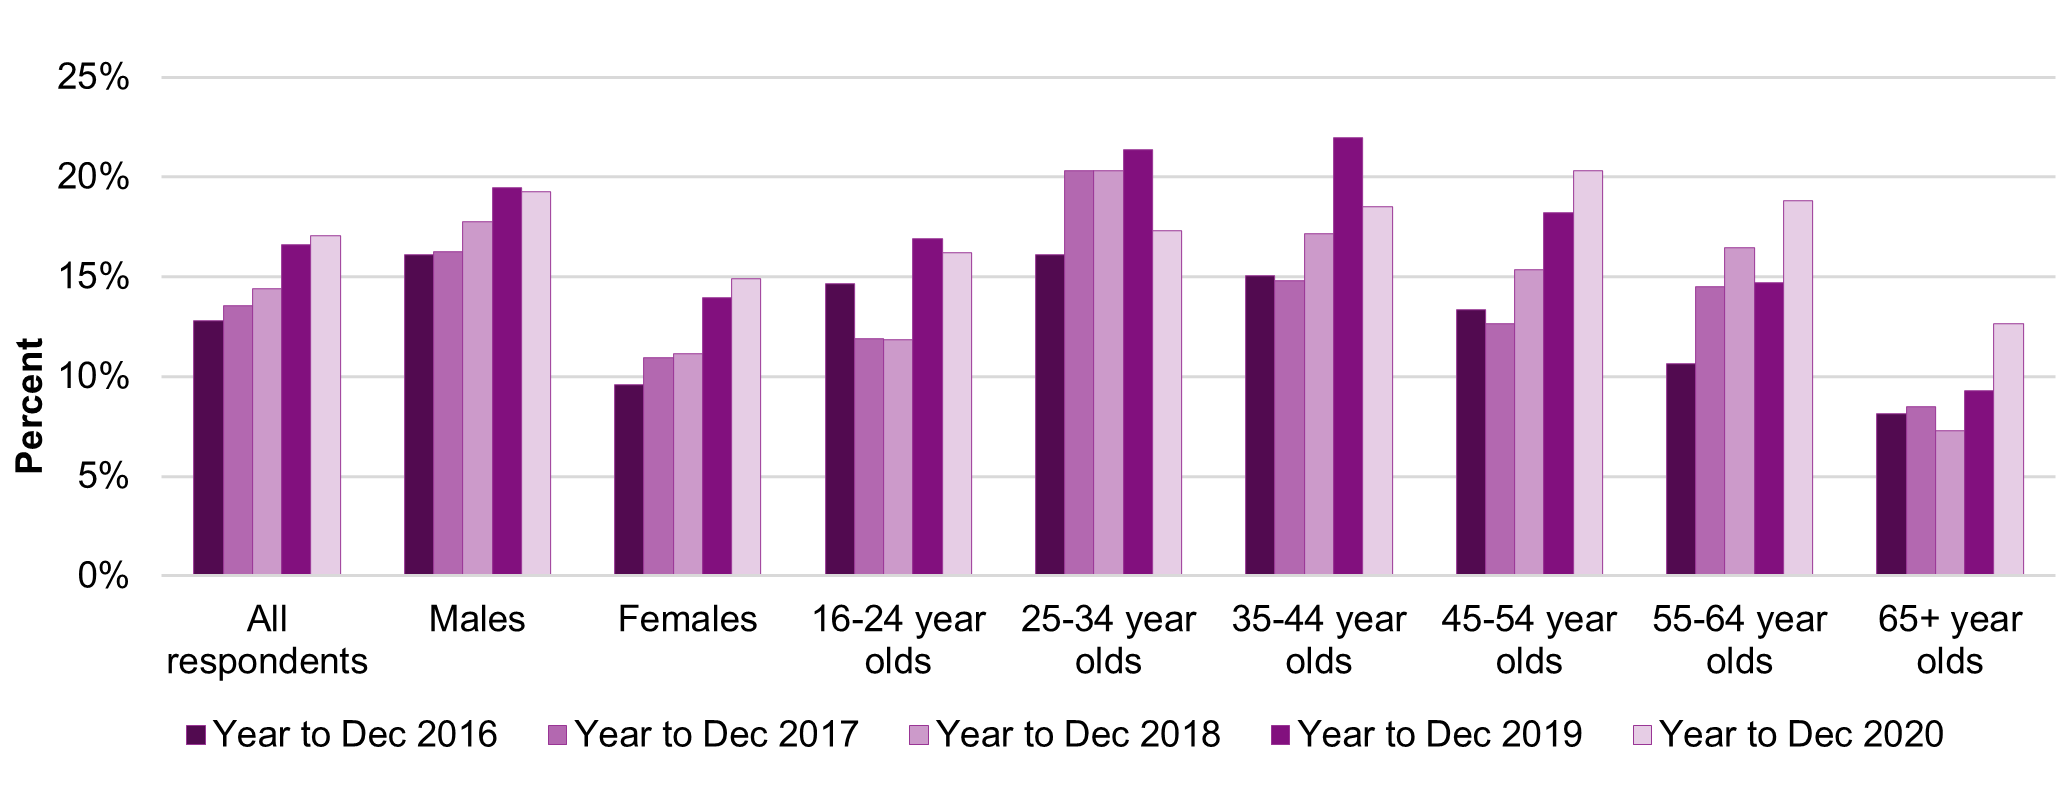
Overall, in the year to December 2020, nearly 24% of adults had gambled online in the previous four weeks, which is a significant increase (3 percentage points) since 2019 and a 6 percentage point increase since 2016.
Figure 4 - Proportion of respondents participating in at least one form of online gambling in the past four weeks, by gender and age
| % | All respondents | Males | Females | 16-24 year olds | 25-34 year olds | 35-44 year olds | 45-54 year olds | 55-64 year olds | 65+ year olds |
|---|---|---|---|---|---|---|---|---|---|
| Year to Dec 2016 | 17.3 | 21.3 | 13.5 | 15.7 | 20.5 | 21.5 | 19.6 | 16.5 | 11.3 |
| Year to Dec 2017 | 18.3 | 21.4 | 15.4 | 13.6 | 24.4 | 22.6 | 18.6 | 20.6 | 11.6 |
| Year to Dec 2018 | 18.5 | 22.5 | 14.5 | 12.2 | 23.1 | 22.0 | 22.0 | 22.7 | 10.6 |
| Year to Dec 2019 | 21.1 | 25.0 | 17.3 | 17.1 | 24.7 | 28.2 | 25.7 | 19.6 | 12.7 |
| Year to Dec 2020 | 23.6 | 26.7 | 20.6 | 17.3 | 21.5 | 29.2 | 29.8 | 27.0 | 17.4 |
| Significant 2019 to 2020 | Yes | Yes | Yes | Yes |
Data shows that for all respondents, online gambling participation rates are increasing. When those who have only played National Lottery draws are removed from the data, the all respondents online participation rate has remained stable between 2019 and 2020.
Figure 5 - Proportion of respondents participating in at least one form of online gambling in the past four weeks excluding those only playing National Lottery draw products, by gender and age
| % | All respondents | Males | Females | 16-24 year olds | 25-34 year olds | 35-44 year olds | 45-54 year olds | 55-64 year olds | 65+ year olds |
|---|---|---|---|---|---|---|---|---|---|
| Year to Dec 2016 | 12.8 | 16.1 | 9.6 | 14.7 | 16.1 | 15.1 | 13.4 | 10.6 | 8.1 |
| Year to Dec 2017 | 13.6 | 16.3 | 11.0 | 11.9 | 20.3 | 14.8 | 12.6 | 14.5 | 8.5 |
| Year to Dec 2018 | 14.4 | 17.7 | 11.2 | 11.9 | 20.3 | 17.1 | 15.4 | 16.5 | 7.3 |
| Year to Dec 2019 | 16.6 | 19.5 | 14.0 | 16.9 | 21.4 | 22.0 | 18.2 | 14.7 | 9.3 |
| Year to Dec 2020 | 17.0 | 19.3 | 14.9 | 16.2 | 17.3 | 18.5 | 20.3 | 18.8 | 12.6 |
| Significant 2019 to 2020 | Yes | Yes |
The ways in which people are participating in a number of gambling activities are changing. For each activity undertaken that can be accessed through different methods, respondents who have participated in the respective activity are asked whether they took part in person only, online only, or both in person and online. There have been significant increases in gamblers taking part in National Lottery draws and other lotteries via an online method.
Problem and at-risk gambling
Problem gambling means gambling to a degree that compromises, disrupts or damages family, personal or recreational pursuits. The Commission’s most robust sources of statistics on the prevalence of problem and at-risk gambling are the the national health surveys (opens in new tab). The Commission also tracks problem gambling data via the quarterly telephone survey to provide a more regular and up to date measure of problem gambling prevalence.
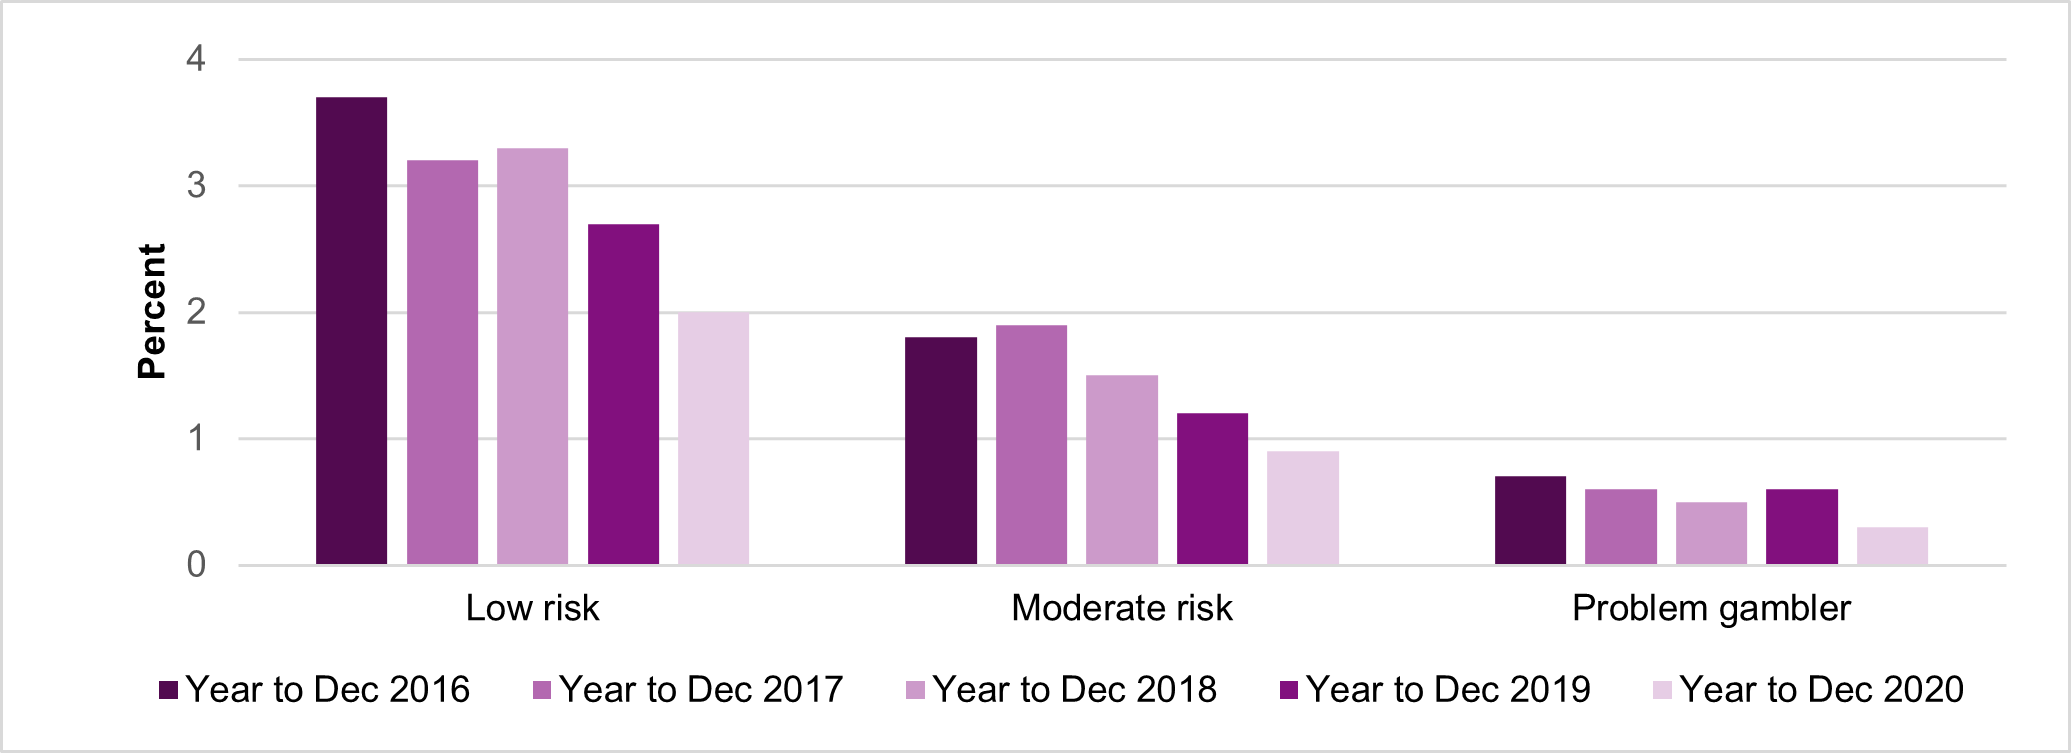
Using the PGSI mini-screen, the telephone survey for year to December 2020 reports the low risk rate to be 2.0% (a significant decrease on the previous year) and the moderate risk rate to be 0.9%. The problem gambling rate in 2020 was 0.3% (down from 0.6% in 2019 – albeit not a statistically significant decrease at the 95% level).
Figure 6 – Low risk, moderate risk and problem gamblers (according to the PGSI mini-screen)
| % | Year to Dec 2016 | Year to Dec 2017 | Year to Dec 2018 | Year to Dec 2019 | Year to Dec 2020 | Significant 2019 to 2020 |
|---|---|---|---|---|---|---|
| Low risk | 3.7 | 3.2 | 3.3 | 2.7 | 2.0 | Yes |
| Moderate risk | 1.8 | 1.9 | 1.5 | 1.2 | 0.9 | |
| Problem gambler | 0.7 | 0.6 | 0.5 | 0.6 | 0.3 |
Perceptions
The Commission has been tracking public perceptions of gambling for over a decade, using questions in the telephone survey.
Trust
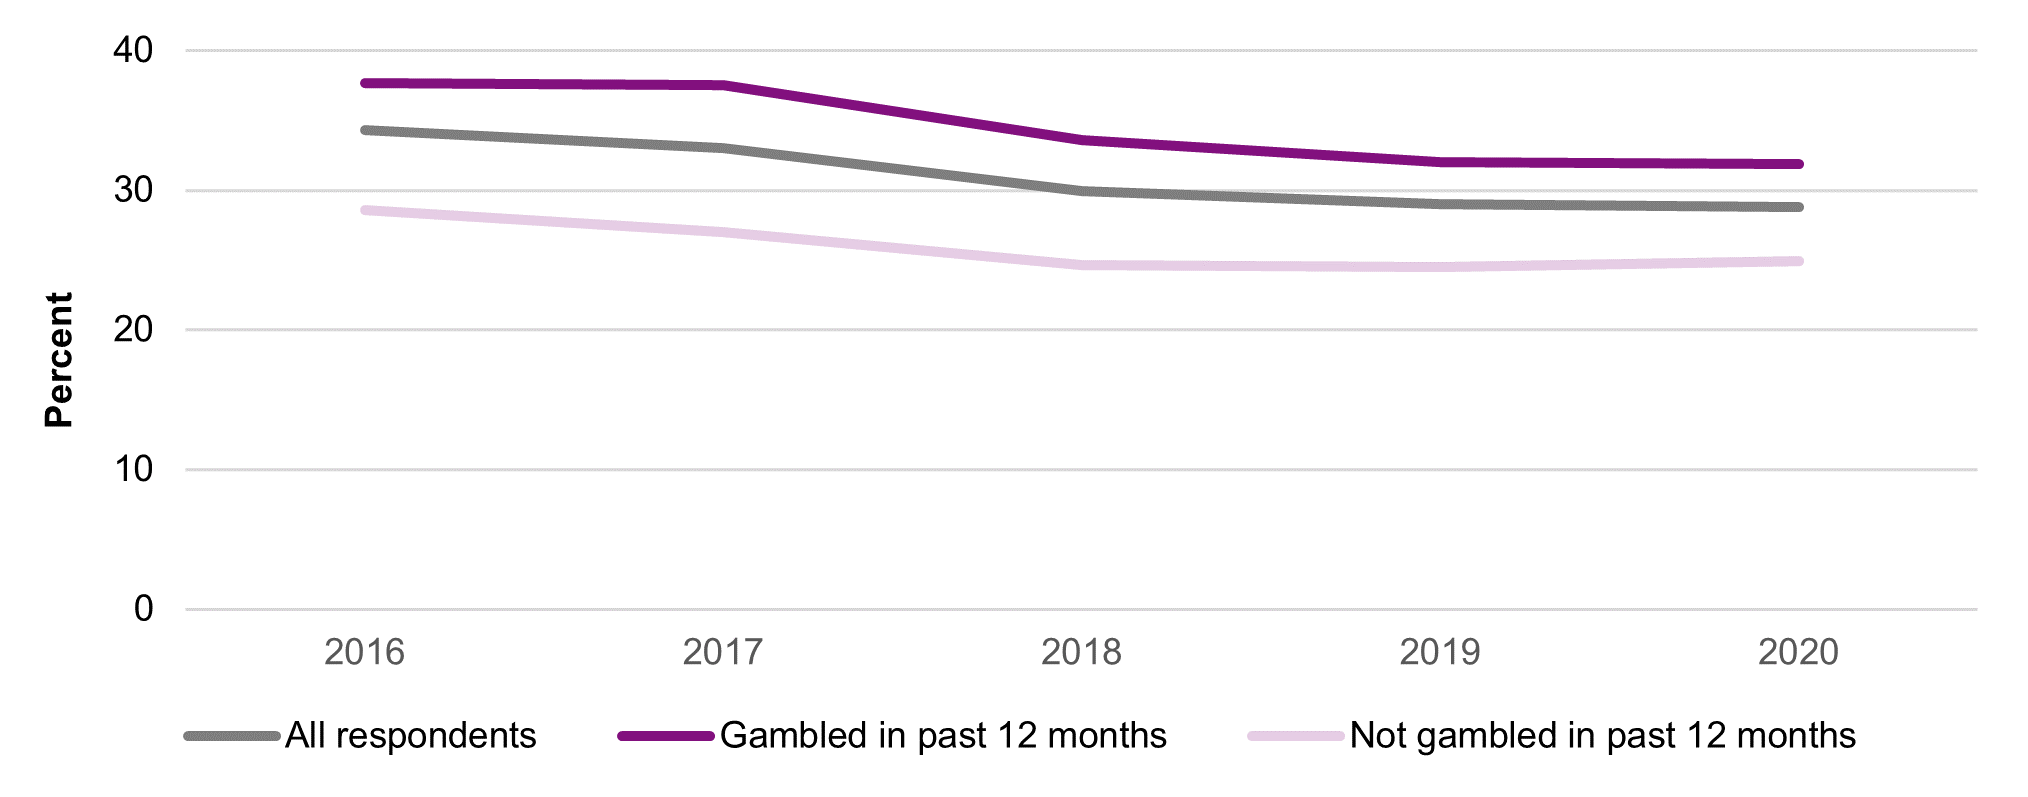
Figure 7 shows the percentage of respondents who agreed, either strongly or slightly, with the statement that gambling in this country is conducted fairly and can be trusted.
In 2020, overall, 29% of respondents agreed with the statement that gambling is conducted fairly and can be trusted, stable compared to the previous year. Gamblers’ attitudes remain more positive than non-gamblers, with a higher proportion of gamblers agreeing with the statement (32%) compared with 25% of non-gamblers.
Figure 7 – Respondents agreeing that gambling in this country is conducted fairly and can be trusted
| % | 2016 | 2017 | 2018 | 2019 | 2020 | Significant 2019 to 2020 |
|---|---|---|---|---|---|---|
| All respondents | 34.3 | 33.0 | 29.9 | 29.0 | 28.8 | |
| Gambled in past 12 months | 37.7 | 37.5 | 33.6 | 32.0 | 31.9 | |
| Not gambled in past 12 months | 28.6 | 27.0 | 24.6 | 24.5 | 24.9 |
Although there has not been a significant change in trust in gambling among all respondents between 2019 to 2020, there has been a significant decline in agreement over the past five years, with the agreement rate falling from 34% in 2016 to 29% in 2020.
Crime
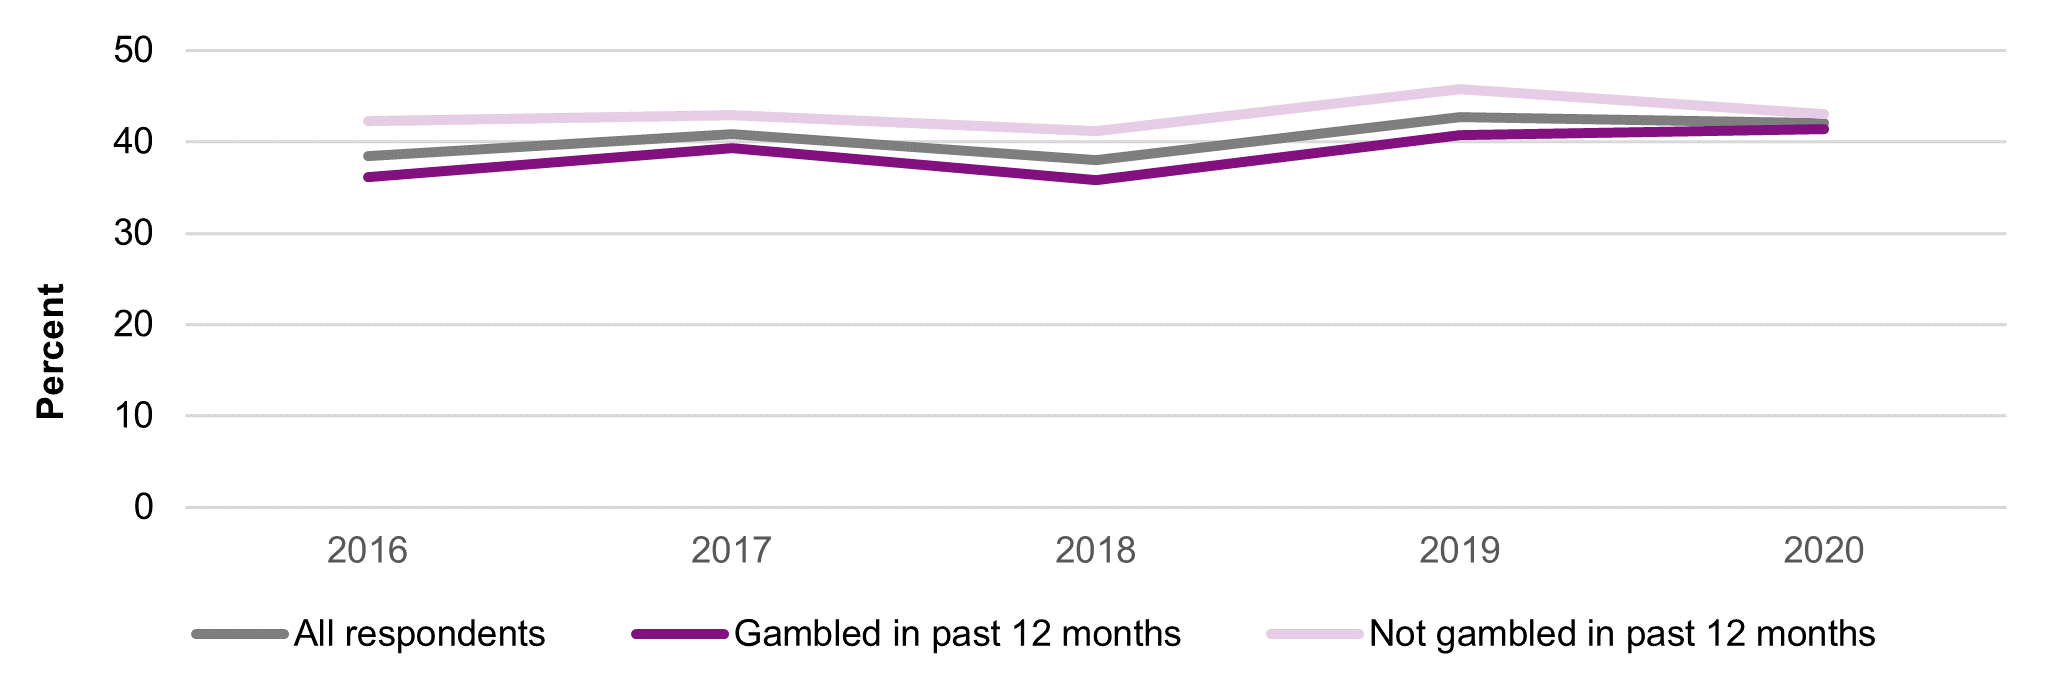
Figure 8 shows the percentage of respondents who agreed, either strongly or slightly, with the statement that gambling was associated with criminal activity.
Overall, in 2020, 42% of respondents agreed with the statement that gambling was associated with criminal activity, which is comparable with the figure reported in 2019 (43%), however, the past five year trend shows that there has been a significant increase in agreement that gambling is associated with criminal activity, largely driven by gamblers themselves.
Figure 8 – Respondents agreeing that gambling in this country is associated with criminal activity
| % | 2016 | 2017 | 2018 | 2019 | 2020 | Significant 2019 to 2020 |
|---|---|---|---|---|---|---|
| All respondents | 38.5 | 40.9 | 38.0 | 42.7 | 42.1 | |
| Gambled in past 12 months | 36.2 | 39.3 | 35.8 | 40.7 | 41.4 | |
| Not gambled in past 12 months | 42.3 | 42.9 | 41.2 | 45.8 | 43.0 |
Attitudes
Respondents were also asked further questions about their attitudes and opinions towards gambling in Great Britain using a series of positive and negative statements originating from a shortened version of the Attitudes Towards Gambling Scale (ATGS-8).
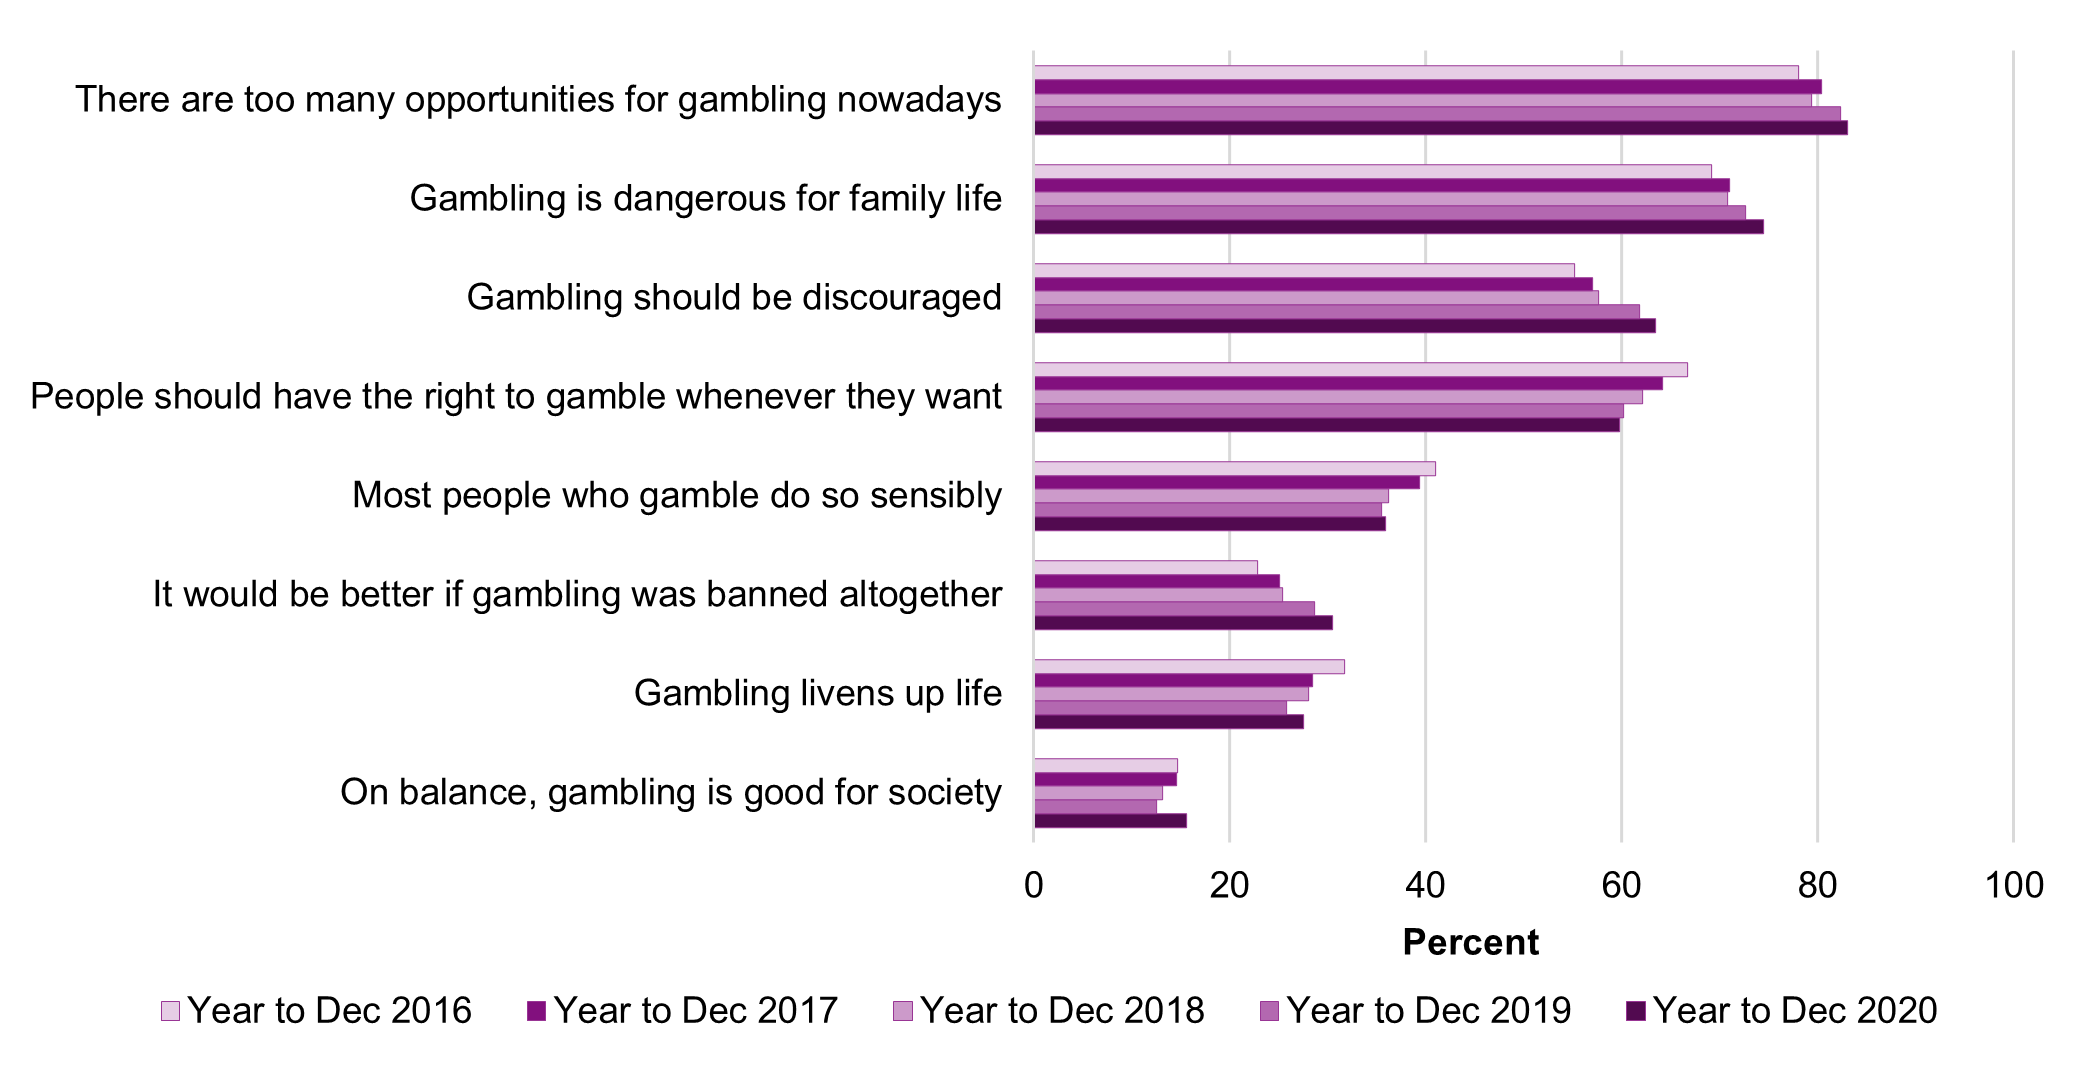
Figure 9 – Respondents agreeing with attitude statements
| % | Year to Dec 2016 | Year to Dec 2017 | Year to Dec 2018 | Year to Dec 2019 | Year to Dec 2020 | Significant 2019 to 2020 |
|---|---|---|---|---|---|---|
| There are too many opportunities for gambling nowadays | 78.0 | 80.4 | 79.4 | 82.3 | 83.0 | |
| Gambling is dangerous for family life | 69.2 | 71.0 | 70.8 | 72.6 | 74.5 | |
| Gambling should be discouraged | 55.2 | 57.0 | 57.6 | 61.8 | 63.4 | |
| People should have the right to gamble whenever they want | 66.7 | 64.2 | 62.1 | 60.2 | 59.8 | |
| Most people who gamble do so sensibly | 41.0 | 39.4 | 36.2 | 35.5 | 35.9 | |
| It would be better if gambling was banned altogether | 22.6 | 25.1 | 25.4 | 28.6 | 30.5 | |
| Gambling livens up life | 31.7 | 28.4 | 28.0 | 25.8 | 27.5 | |
| On balance, gambling is good for society | 14.7 | 14.6 | 13.1 | 12.5 | 15.6 | Yes |
In 2020, 83% of respondents agreed that there are too many opportunities for gambling, 75% agreed that gambling is dangerous for family life and 63% agreed that gambling should be discouraged.
Despite this, 60% of respondents agreed that people should have the right to gamble whenever they want and 36% agreed that most people who gamble do so sensibly. The only significant change seen in respondents’ attitudes since 2019, was the proportion agreeing that on balance, gambling is good for society (16%), an increase of 3 percentage points.
Notes
This publication is primarily for anyone who has an involvement or interest in the gambling industry including government, licensed operators, trade bodies, international regulators, journalists, academic researchers, financial institutions, statisticians, consumers and local authorities.
About the status of official statistics.
We intend to publish the next quarterly participation and prevalence statistics in April 2021.
1At the 95% level of confidence
Data and downloads
Files
Feedback
We are always keen to hear how these statistics are used and would welcome your views on this publication.