
Report
Initial findings from new data on consumer trust – GSGB
Initial findings from new data on consumer trust – GSGB
Transparency and fairness
Transparency and fairness are core drivers of consumer trust in any industry, not just in gambling. However, they are particularly relevant in this sector and link directly back to the Commission’s licensing objective to ensure that gambling is conducted in a fair and open way. In the earlier phase of this research participants talked about the understandability of terms and conditions, the presence of clear information about how games work, odds and offers, and wider points around fair gameplay.
"You only read terms and conditions when you have a problem and then you start going through them and scratching your head."
– Qualitative Research Participant
This driver was measured using the following statements:
Gambling games and machines are fair and free from errors
Activities, offers and odds provided by gambling companies are clear, easy to understand and not misleading.
Gambling games and machines are fair and free from errors
8 percent of people who had gambled in the past 12 months agreed with this statement, with 23 percent responding neutrally, and 70 percent disagreeing. This may be linked to levels of gambling literacy and comprehension of the way that gambling games and products work, and the inherent chance and risk associated with taking part in certain activities.
“My perception is that the majority of the time people lose so I assume there may be faults and/or unfairness with games and/or slot machines.”
– Qualitative Research Participant
However, in the earlier phases of the research some participants expressed confidence in the way that games are offered.
"Knowing a game has random odds and a random selection that is not rigged in terms of winning and losing, gives me some reassurance."
– Qualitative Research Participant
Younger people (aged 18 to 45) had higher levels of disagreement that gambling games and machines are fair and free from errors (71 to 77 percent) compared to those over 45 (62 to 67 percent), with the highest disagreement among 18 to 24 year olds and the highest agreement for those aged 75 and over (10 percent).
Men had higher levels of agreement that gambling games and machines are fair and free from errors (9 percent compared to 6 percent) and women had higher levels of disagreement (72 percent compared to 68 percent).
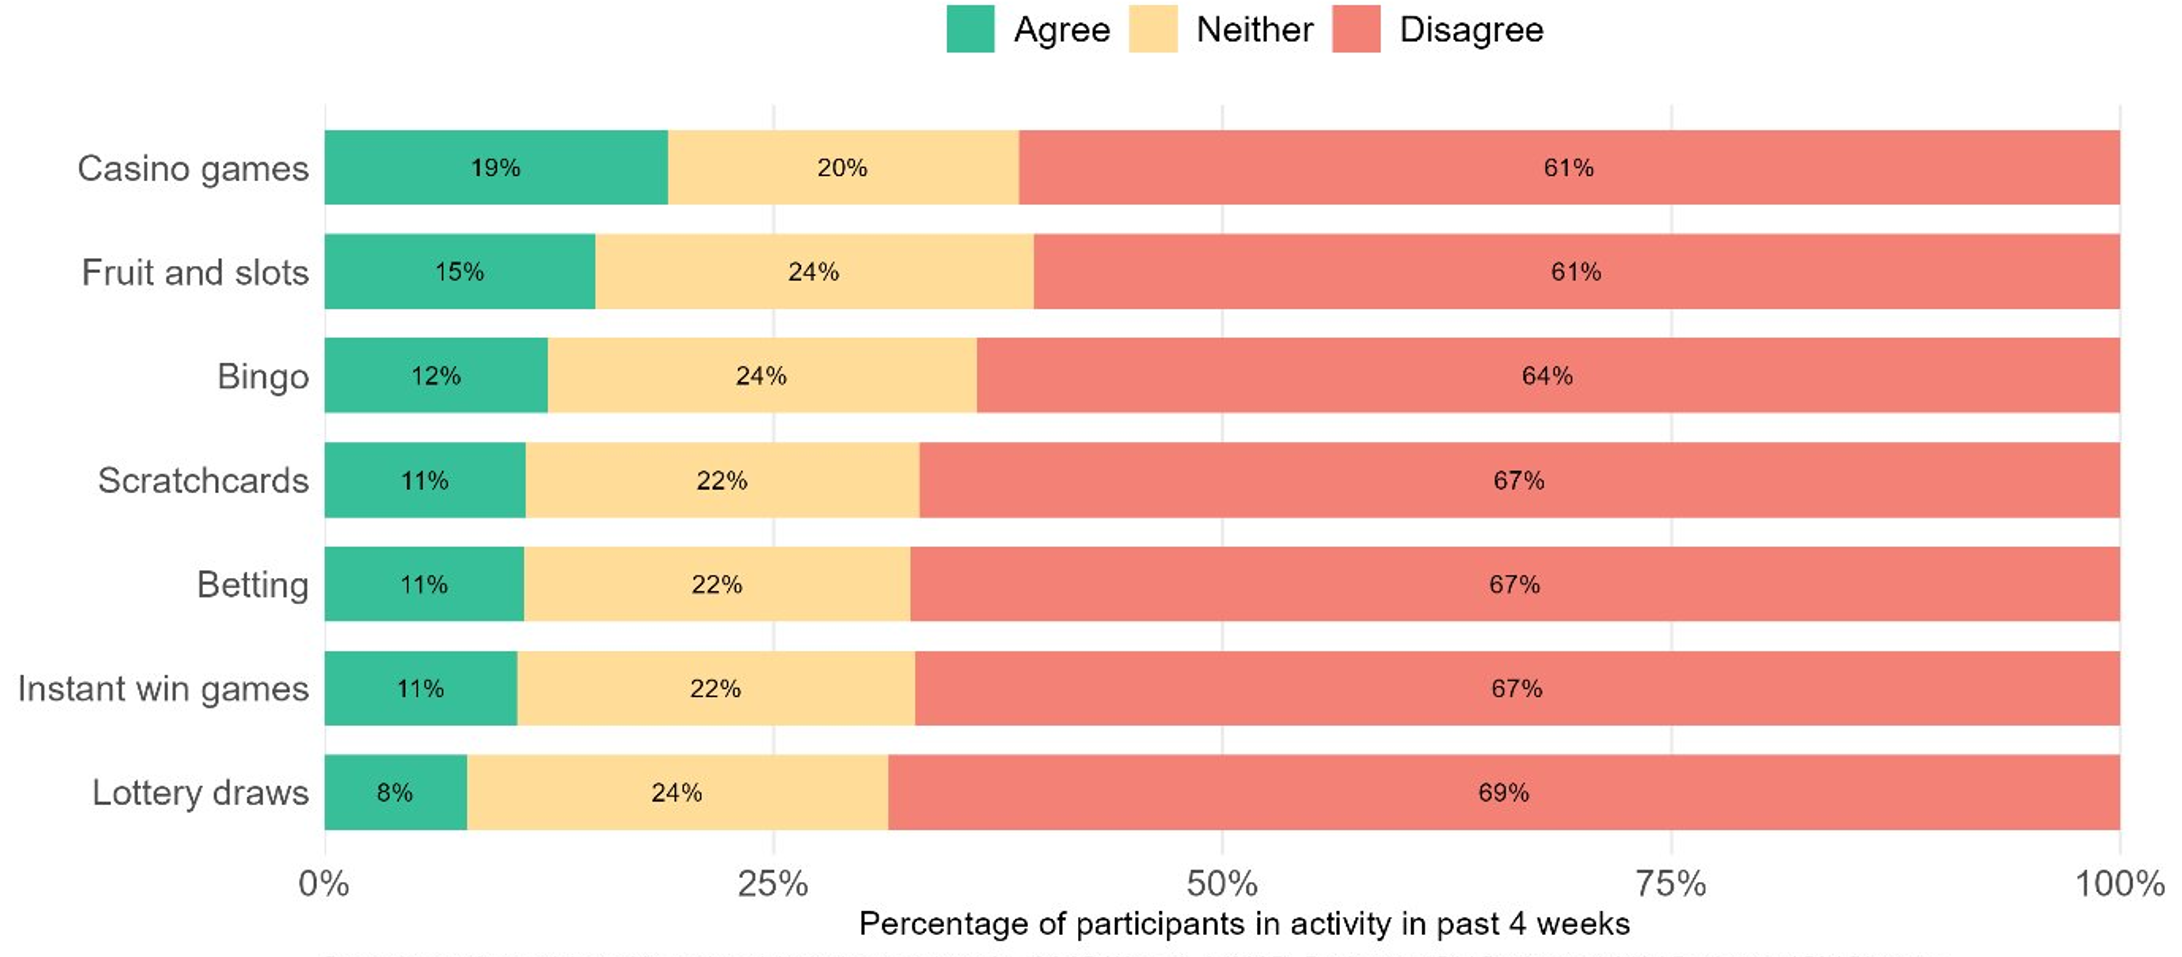
Levels of agreement to this statement varied by the type of gambling activity participants had played in the past 4 weeks, and whether they had enjoyed their most recent gambling experience. Those that participated in lottery draws were least likely to agree that gambling games are fair and free from errors, and those who had played casino games had the highest level of agreement, followed by playing fruit and slots in the past 4 weeks (19 percent and 15 percent respectively and shown in figure 7. Agreement with the statement did not differ significantly based on whether participants rated their last gambling experience as ‘negative’ (7 percent,) ‘neutral’ (5 percent) or ‘positive’ (10 percent).
Figure 7: Agreement level with ‘games and machine fairness’ statement by gambling activity in the past 4 weeks
| Activity | Agree (percentage) | Neither (percentage) | Disagree (percentage) |
|---|---|---|---|
| Casino games | 19 | 20 | 61 |
| Fruit and slots | 15 | 24 | 61 |
| Bingo | 12 | 24 | 64 |
| Scratchcards | 11 | 22 | 67 |
| Betting | 11 | 22 | 67 |
| Instant win games | 11 | 22 | 67 |
| Lottery draws | 8 | 24 | 69 |
Activities, offers and odds provided by gambling companies are clear and easy to understand and not misleading
19 percent of past 12-month gamblers agreed with this statement, with 31 percent responding neutrally, and 50 percent disagreeing. Some participants in the earlier phase of research explained that they didn’t understand some elements of gambling and struggled to comprehend the rules or terms and conditions provided by operators.
“I never bet on games with “odds”, I don’t understand how they are worked out”
– Qualitative Research Participant
There was little difference in agreement across age groups (all between 16 to 21 percent with no pattern), but large differences in disagreement with a clear trend that younger people are more likely to disagree that activities, odds and offers are clear and easy to understand. People aged 18 to 24 had the highest levels of disagreement (61 percent) whilst those aged over 75 had the lowest levels (44 percent). This could be driven by levels of gambling experience or the types of activities that are played by younger people.
Men are significantly more likely to agree that activities, offers and odds provided by gambling companies are clear and easy to understand and not misleading (22 percent compared to 15 percent), whilst women are more likely to disagree (54 percent compared to 48 percent).
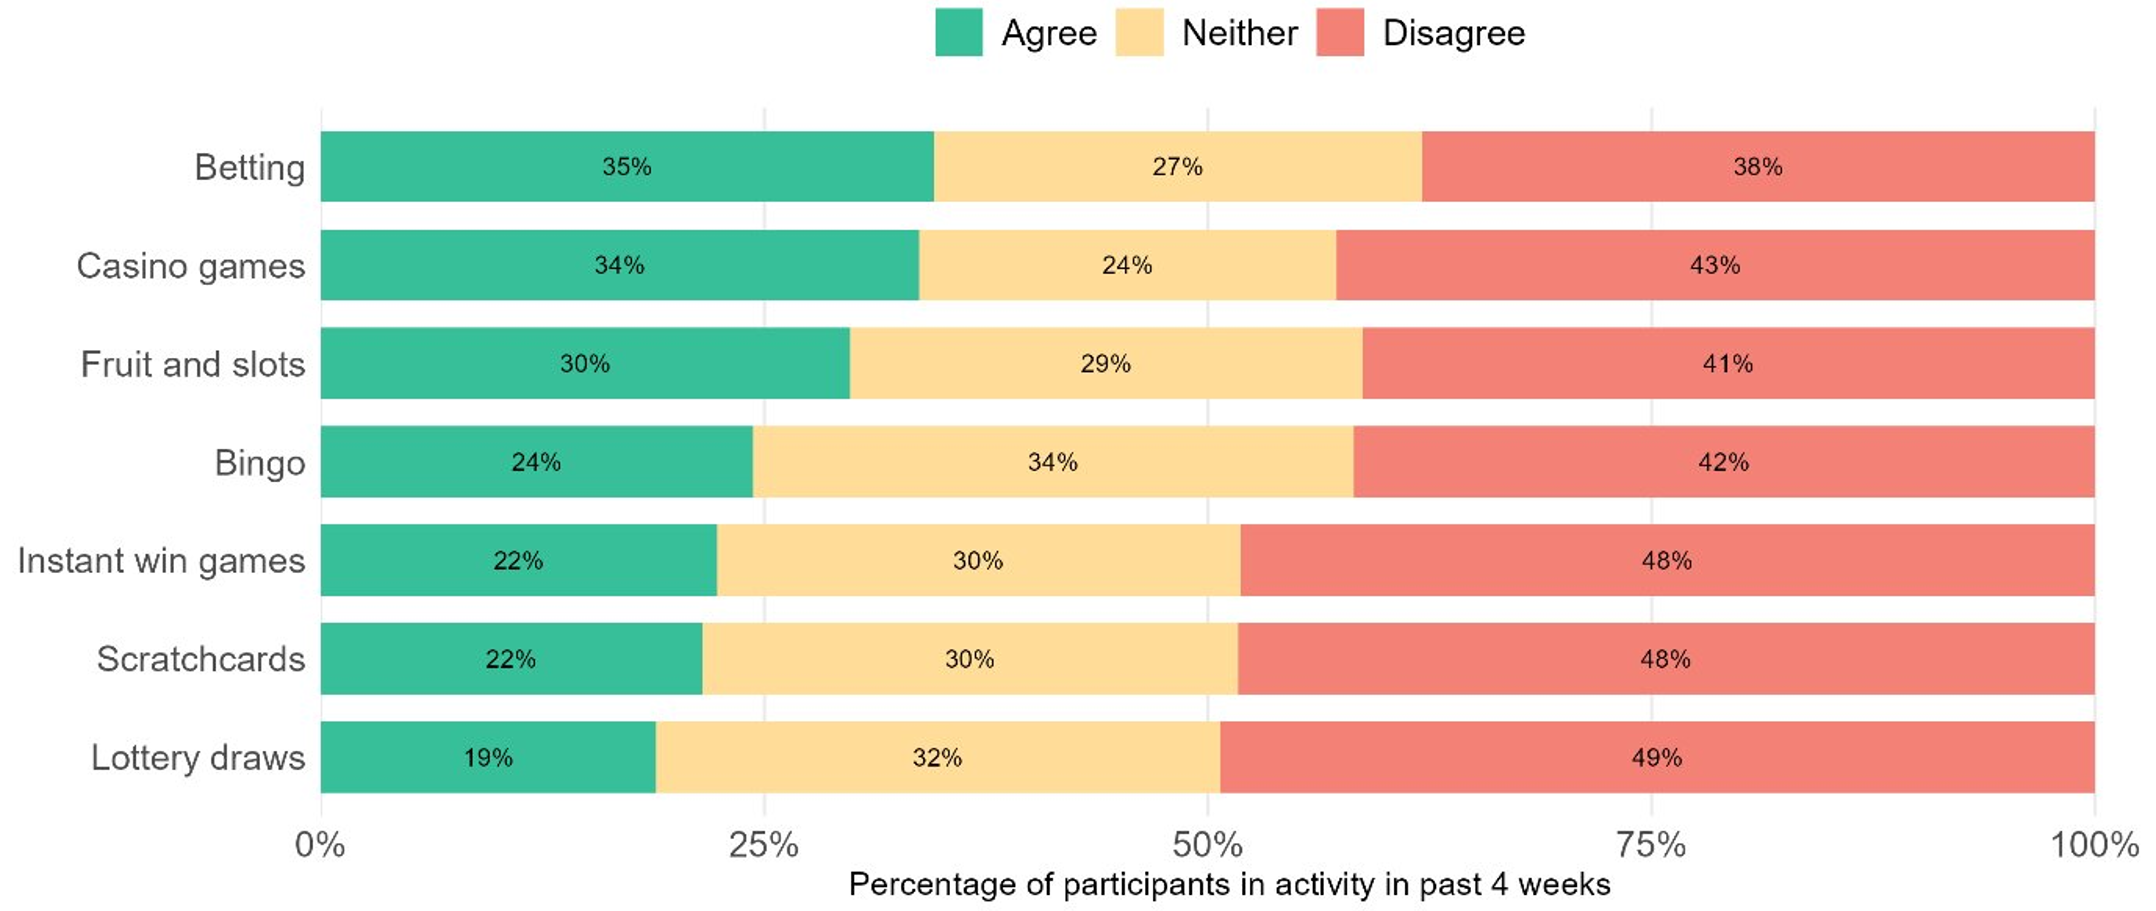
Levels of agreement were highest among participants who had engaged in casino games or betting over the past 4 weeks (34 to 35 percent), while those who had played Lottery draws had the lowest levels of agreement (19 percent) as shown in Figure 8. Participants who rated their most recent gambling experience as positive were more likely to agree that activities, offers and odds are easy to understand (25 percent), compared with those who rated their experience as neutral (14 percent) or negative (12 percent).
Figure 8: Agreement level with ‘activities, odds and offers’ statement by gambling activity in the past 4 weeks
| Activity | Agree (percentage) | Neither (percentage) | Disagree (percentage) |
|---|---|---|---|
| Betting | 35 | 27 | 38 |
| Casino games | 34 | 24 | 43 |
| Fruit and slots | 30 | 29 | 41 |
| Bingo | 24 | 34 | 42 |
| Instant win games | 22 | 30 | 48 |
| Scratchcards | 22 | 30 | 48 |
| Lottery draws | 19 | 32 | 49 |
The next page in this section is Advertising and promotion.
Last updated: 23 July 2026
Show updates to this content
No changes to show.