
Report
Exploring online, illegal, individual-led lotteries and raffles
Exploring online, illegal, individual-led lotteries and raffles
Scale of participation in online individual-led lotteries and raffles
Involvement is niche overall, with Facebook showing higher rates of exposure and participation
According to the quantitative research, participation in online individual-led lotteries and raffles is low. When looking at specific websites, 5 percent of respondents surveyed reported ever taking part in a Facebook raffle, followed by TikTok and Instagram both at 3 percent. 16 percent said they had seen online individual-led lotteries and raffles promoted on Facebook, compared with 10 percent who had seen them on TikTok. The prevalence of self-reported hosts was extremely low, with 1 percent of people reporting hosting an online individual-led lottery or raffle on each platform or website asked about. Table 1 illustrates the full participation and exposure rates for each website asked about in the survey.
Table 1: Thinking about these online individual-led lotteries or raffles, have you ever done any of the following through your account on...
| Platform | Taken part (percentage) | Seen only (percentage) | Hosted (percentage) | Never seen of hosted (percentage) | Do not have account (percentage) |
|---|---|---|---|---|---|
| TikTok | 3% | 10% | 1% | 32% | 54% |
| 5%* | 16%* | 1% | 58% | 19% | |
| 3% | 13%* | 1% | 45% | 37% | |
| Twitch | 2% | 4% | 1% | 21% | 73% |
| Discord | 2% | 4% | 1% | 25% | 69% |
| Telegram | 2% | 3% | 1% | 24% | 70% |
| 2% | 4% | 1% | 31% | 62% | |
| 2% | 6% | 1% | 76% | 14% | |
| Other websites: for example, Raffall, BOTB, Jammy 5 | 6%* | 5% | 1% | 32% | 55% |
*Indicates significantly higher than TikTok for ‘Taken part’ or ‘Seen only'.
Engagement is higher among young players and those with higher PGSI scores
The quantitative research found that more vulnerable groups, such as young adults (especially those aged 18 to 24) and people with PGSI scores of 8 or more, were more likely to engage with online individual-led lotteries and raffles.
When looking at rates between age groups specifically, those under 35 are significantly more likely to have taken part in or seen an online individual-led lottery or raffle compared to older age groups. For context, while 10 percent of 18 to 24-year-olds report taking part on TikTok, this drops sharply to 2 percent among 35 to 44-year-olds, and to less than 1 percent for those aged 45 and over.
Table 2 shows the breakdown between age groups.
Table 2: Thinking about these online individual-led lotteries or raffles, have you ever done any of the following through your account on TikTok?
| Age | Taken part (percentage) | Seen only (percentage) |
|---|---|---|
| 18 to 24 | 10% | 34% |
| 25 to 34 | 7% | 19% |
| 35 to 44 | 2% | 10% |
| 45 to 54 | Less than 1% | 4% |
| 55 to 64 | Less than 1% | 2% |
| 65 and over | 0% | 1% |
| Total | 3% | 10% |
Note: 16 to 17 not included in the chart due to a very small base (8)
Why these draws resonate with younger audiences
Digital intelligence helps explain why this activity is so concentrated among younger adults. The spaces where these draws thrive, such as TikTok LIVE and algorithmic 'For You' pages, are native to younger online audiences. The content observed in the digital phase is fast-paced, highly visual, and driven by influencers who interact with their audience as peers rather than as traditional operators.
The use of hype-building countdowns, emojis, and casual language (such as 'giveaways' or 'prize drops') closely mirrors wider youth internet culture, gaming streams, and influencer merchandise drops. This creates an environment where paid-entry draws blend seamlessly into the digital entertainment young adults are already consuming, lowering the barrier to entry and normalising the activity without it ever feeling like traditional gambling.
Engagement is frequent among participants
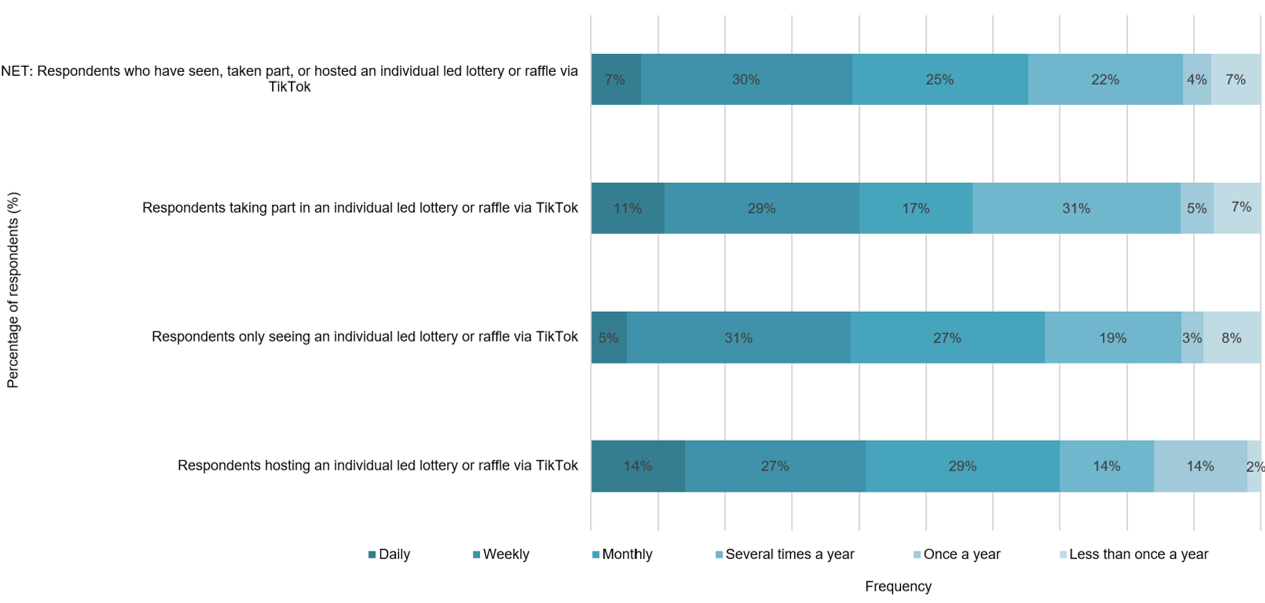
Figure 1: On average, how often do you do take part in, see, or host online individual-led lotteries or raffles via TikTok?
| People | Daily (percentage) | Weekly (percentage) | Monthly (percentage) | NET: Frequently (Daily, Weekly, Monthly) (percentage) | Several times a year (percentage) | Once a year (percentage) | Less than once a year (percentage) |
|---|---|---|---|---|---|---|---|
| People taking part in, seeing, or hosting an individual led lottery or raffle via TikTok | 7% | 30% | 25% | 62% | 22% | 4% | 7% |
| People taking part in an individual led lottery or raffle via TikTok | 11% | 29% | 17% | 57% | 31% | 5% | 7% |
| People only seeing an individual led lottery or raffle via TikTok | 5% | 31% | 27% | 63% | 19% | 3% | 8% |
| People hosting an individual led lottery or raffle via TikTok | 14% | 27% | 29% | 70% | 14% | 14% | 2% |
*Caution: low base size
Figure 1 highlights the frequency that quantitative survey participants report taking part in, seeing, or hosting online individual-led lotteries and raffles, specifically via TikTok. It shows that those who take part tend to do so frequently, with over half of those who participated saying they do so at least monthly on average. This is consistent with the pattern identified in the digital intelligence research, where repeated exposure on algorithm-led platforms may reinforce participation over time.
References
5 The 'Other websites' category was an open-text option in the survey where participants provided their own answers, which included names such as Raffall, BOTB, and Jammy. It is important to note that some of those listed are free draw operators that fall outside the remit of gambling regulation. The fact that participants listed them here highlights the ongoing consumer ambiguity in distinguishing between lawful free draws and illegal lotteries. This consumer confusion aligns with findings from previous phases of the Commission's Illegal Gambling research.
Setting the scene Next section
Routes into online individual-led lotteries and raffles
Last updated: 13 August 2026
Show updates to this content
No changes to show.