- Print the full document
- Save the page as a HTML document to your device
- Save the page as a PDF file
- Bookmark it - it will always be the latest version of this document
This box is not visible in the printed version.
Young People and Gambling 2023: Official statistics
Gambling Commission report produced by Ipsos on young people and their gambling behaviour, attitudes and awareness in 2023.
Published: 16 November 2023
Last updated: 7 November 2025
This version was printed or saved on: 30 June 2026
Online version: https://www.gamblingcommission.gov.uk/report/young-people-and-gambling-2023
Executive summary
Introduction
This report contains the findings from the Gambling Commission’s annual study, produced by Ipsos, exploring gambling behaviours among young people in Great Britain.
The survey examined gambling experience and behaviours, such as where young people gamble and with whom, perceptions of gambling and awareness of gambling advertising. The survey also asked a series of questions relating to potential issues associated with gambling and utilised the problem gambling screen Diagnostic and Statistical Manual of Mental Disorders 4th Edition - Multiple Response Juvenile (DSM-IV-MR-J) to classify gamblers as at risk or problem gamblers. Before the 2022 survey took place, the Gambling Commission conducted a programme of research to improve the collection of official statistics around gambling participation.
The research was conducted in schools, with pupils completing online self-completion surveys in class. The study collected data from a sample of 3,453 11 to 17 year olds attending academies, maintained and independent schools in England, Scotland, and Wales. In previous years the survey has collected data from 11 to 16 year olds, in school years 7 to 11 in academies and maintained secondary schools. This year an addition was made to include 17 year olds, those in year 12, as well as pupils from independent schools. Fieldwork took place between February to July 2023. Further details of the methodology, sampling and weighting processes, and sample profile are included in the Appendices of this report.
Headline statistics
26 percent of 11 to 17 year olds spent their own money on gambling in the twelve months prior to taking part in the survey.
During that period, the most common types of gambling activity that young people spent their own money on were legal or did not feature age restricted products, namely:
- playing arcade gaming machines such as penny pusher or claw grab machines (19 percent)
- placing a bet for money between friends or family (11 percent)
- playing cards with friends or family for money (5 percent).
19 percent of young people were spending their own money on regulated forms of gambling (which includes some activities that are legal and played within licensed premises), and 14 percent on unregulated forms of gambling (gambling activities which fall outside the remit of the Gambling Commission).
The youth-adapted problem gambling screen (Diagnostic and Statistical Manual of Mental Disorders 4th Edition - Multiple Response Juvenile (DSM-IV-MR-J)) identified 0.7 percent of 11 to 17 year olds as problem gamblers, 1.5 percent as at risk gamblers and 23 percent as non-problem gamblers.
Three in ten (28 percent) young people had seen the family members they live with gamble, with 14 percent indicating that it had resulted in arguments or tension at home. Just over one in ten (11 percent) said that their own gambling had led them to talk to their parents about how they felt while 6 percent said that gambling had made them feel uncomfortable around their friends (such as feeling embarrassed or feeling friends would not approve).
Presentation and interpretation of data
When interpreting the findings, it is important to remember that results are based on a sample of the maintained and independent school population, and not the entire population of 11 to 17 year olds in England, Scotland, and Wales. The survey data reported here has been weighted to ensure the findings are nationally representative of young people at secondary schools in England, Scotland and Wales (see Appendices of this report) for more detail on weighting). Applying weights to the data, while tending to make the quoted figures more representative of the population of interest, also reduces the statistical reliability of the data. Results from any survey are estimates, and there is a margin of error associated with each figure quoted. Essentially, the smaller the sample size, the greater the uncertainty.
Throughout this report, unless specified, findings with sufficient sample sizes have been included and all differences noted between subgroups are significant at the 95 percent significance level. A guide to statistical significance is included in the Appendices of this report.
Key terms used in the report
Prior to 2022, young people were asked one question to find out whether they had used their own money to gamble and when they had done so. The development work that took place before the 2022 survey noted that it was cognitively challenging for young people to remember the types of gambling activities they had participated in whilst keeping in mind if, and when, they had spent their own money on these activities.
Taking on board recommendations relating to the questionnaire design, meant that a different approach was adopted in 2022, with three questions included in order to understand, firstly, whether a young person had any experience of gambling, secondly, if they had ever gambled using their own money and thirdly, when they did so. As a result, we have two possible ways of interpreting gambling behaviour which are referenced throughout this report:
Active involvement in gambling – Young people who spent their own money (defined as any pocket money, birthday money or money they earned themselves) in the last 12 months on gambling.
Experience of gambling – Young people who have gambled, but not necessarily spending their own money on doing so.
The Gambling Commission regulates gambling operators and key individuals. Regulation is designed to ensure children and young people are unable to gamble on age-restricted products licensed by the Gambling Commission. In addition to products licensed by the Gambling Commission, this report also covers a number of gambling activities which sit outside the Gambling Commission’s remit and are legally available to children and young people. In order to distinguish between these different types of gambling we refer in this report to Regulated and Unregulated forms of gambling:
Regulated forms of gambling – Those gambling activities which are licensed and regulated by the Gambling Commission including betting or casino gaming provided by a licensed operator online or from premises, playing the National Lottery or other lottery products. This categorisation also includes playing gaming machines in betting shops, bingo premises, casinos or arcades. Due to different categories and requirements relating to gaming machines this report may include some gaming machine play which is not directly regulated by the Gambling Commission and in some incidences can be legally played by children and young people.
Unregulated forms of gambling – Those gambling activities which fall outside the remit of the Gambling Commission such as non-commercial gambling between friends and family or playing bingo somewhere other than a bingo club.
For further information on terms used throughout this report and their definitions see Appendices of this report.
Acknowledgements
We are indebted to all pupils and staff who made this survey possible during a time when schools are managing heavy workloads. Without their support, this survey would not have been possible.
Young people’s active involvement in gambling
Summary
This first section of the report examines young people’s active involvement in gambling, which is self-reported experience of spending their own money on gambling over the last 12 months.
Throughout this chapter we make comparisons to the data in 2022. However, it should be noted that the 2022 sample did not include year 12 pupils or independent schools, so any differences are indicative only.
Just over one quarter (26 percent) of 11 to 17 year olds were actively involved in gambling in the last 12 months, having spent their own money on gambling activities. They were most likely to have spent their own money on types of gambling activity that are legal or do not feature age restricted products such as penny pusher or claw grab arcade games (19 percent) or bet for money between friends or family (11 percent).
Using the youth-adapted problem gambling screen, the survey identified 0.7 percent of 11 to 17 year olds as problem gamblers, 1.5 percent as at risk and 23 percent as non-problem gamblers. Young people who define themselves as white were more likely to be identified as non-problem gamblers than those from a black or minority ethnic group and those aged 11 to 13 years old were more likely to be categorised as problem gamblers than those aged 14 to 16 years but not more likely than 17 year olds.
Young people's active involvement in gambling
Just over one quarter (26 percent) of 11 to 17 year olds spent their own money (for example pocket money, birthday money or money they earned themselves) on gambling activities in the 12 months prior to taking part in the survey.
Young people were most likely to have spent their own money on arcade games such as penny pusher or claw grab machines (19 percent) or bet for money between friends or family (11 percent), than other gambling activities, as shown in Figure 1.
The amount of young people spending their own money on gambling activities has decreased this year, by 5 percentage points from 31 percent, when compared to 2022. Arcade games and bets for money between friends or family were also the most likely activities for young people to have spent their money on in 2022 at 22 percent and 15 percent respectively.
Figure 1: Young people’s active involvement in gambling – top ten gambling activities young people spent their own money on

Figure 1 information
GAMSPEND4. And when did you last spend money on [this activity or these activities]? Was it …?
Base: All 11 to 17 year olds answering (3,453).
Note: multiple response question, therefore answers do not sum to 100 percent.
| Top ten gambling activities young people spent their own money on | Percentage (multiple response question, therefore answers do not sum to 100 percent) |
|---|---|
| Spent money on any gambling activity in last 12 months | 26% |
| Played arcade gaming machines | 19% |
| Placed a bet for money between friends or family | 11% |
| Played cards for money | 5% |
| Played fruit or slot machines | 3% |
| Played bingo at somewhere other than a bingo club | 1% |
| Placed a bet on esports | 1% |
| Placed a bet at a betting shop or bookies | 1% |
| National Lottery scratchcards | 1% |
| National Lottery draw | 1% |
Young people were more likely to spend their own money on regulated forms of gambling (19 percent), than unregulated forms of gambling (14 percent) in the last 12 months. The figure for regulated forms of gambling includes machines and bingo play in premises that are not regulated by the Gambling Commission but have a permit from the local council, while the unregulated figure includes bingo play in premises where bingo is licensed, requires permits and where no permission is required (further explanation of terms used in the report can be found in Appendices . Removing arcade gaming machines, which young people can play legally, the percentage of 11 to 17 year olds who spent their own money on forms of regulated gambling falls to 4 percent.
Young people were also more likely to spend their own money on regulated forms of gambling than unregulated forms of gambling in 2022. The proportions, however, have decreased this year from 23 percent and 18 percent respectively.
Variations in active involvement in gambling
The proportion of young people who actively spent their own money (for example pocket money, birthday money or money they earned themselves) on gambling activities in the 12 months is consistent by age and gender.
Those who define their ethnicity as white were more likely than young people from black or ethnic minority backgrounds to have spent their own money on gambling in the last 12 months (27 percent, compared with 21 percent). This finding could have been driven by the fact that active involvement in gambling was notably higher among young people who had seen their family members gamble, who in turn are more likely to come from white ethnic background (30 percent, compared with 21 percent of those in the black and minority ethnic group).
These trends are in line with 2022, though the proportion of those who define their ethnicity as white and have spent their own money on gambling in the last 12 months has decreased from 34 percent with the proportion who have seen their family members gambling also decreasing from 47 percent.
Variations in active involvement in types of gambling activities
There were no variations by gender or age when we viewed active involvement in different types of gambling activities. However, ‘at risk’ gamblers were more likely than all respondents to have been actively involved in a wider range of different types of gambling.
Prevalence of non-problem, at risk or problem gambling
The survey identified 0.7 percent of 11 to 17 year olds as problem gamblers, 1.5 percent as at risk gamblers and 23 percent as non-problem gamblers. Around three quarters (74.2 percent) of young people did not actively gamble in the last 12 months. All data is based on self-reported active involvement in gambling in the last 12 months.
These categories are defined by the problem gambling screen Diagnostic and Statistical Manual of Mental Disorders 4th Edition – Multiple Response Juvenile (DSM-IV-MR-J) devised by Fisher (2000). It is important to bear in mind that this is a youth-adapted problem gambler screen, which takes account of adolescent behaviour such as spending dinner money on gambling or arguing with friends. It is not comparable with adult problem gambling screens, which include measures such as the impact of gambling on household finances. Information on how the screen is applied for this survey can be found in the Appendices.
The proportion of young people identified as at-risk gamblers has decreased from 2.4 percent at risk, as has the proportion identified as non-problem gamblers from 27.3 percent, since 2022. The proportion of those who did not actively gamble is now three quarters, 74 percent, having increased 5.5 percentage points.
Figure 2: Types of gambler defined by the youth-adapted problem gambling screen – prevalence of non-problem, at risk or problem gambling

Figure 2 information
Chart shows types of gamblers as defined by the DSM-IV-MR-J youth-adapted problem gambling screen.
Base: All 11 to 17 year olds answering (3,453).
Note: The chart does not show the 1 percent of gamblers who did not provide a response at any question in the gambling screen.
| Types of gamblers | Percentage |
|---|---|
| Non-gambler | 74.2% |
| Non-problem gambler | 23.0% |
| At risk gambler | 1.5% |
| Problem gambler | 0.7% |
Problem gambling by gender
Boys were more likely to be classified as problem gamblers than girls (0.9 percent compared to 0.1 percent ). The numbers of individuals who fall into the categories of ‘at risk gamblers’ and ‘problem gamblers’ are low (below our threshold for analysis of 50 or more cases). As such these results should be treated with caution.
In 2022 there was no significant difference between boys and girls. This change to a difference in 2023 is largely driven by the decrease in the proportion of girls classified as problem gamblers (to 0.1 percent from 0.9 percent) whereas the proportion of boys has not seen a significant difference between the two years.
Table 1: Types of gamblers by gender (last 12 months)
Table 1 information
The numbers of individuals who fall into the categories of ‘at risk gamblers’ and ‘problem gamblers’ are low (below our threshold for analysis of 50 or more cases). As such these results should be treated with caution.
| Gender | Total | Non-gambler | Non-problem gambler | At risk gambler | Problem gambler | ||||
|---|---|---|---|---|---|---|---|---|---|
| Base size | Percentage | Base size | Percentage | Base size | Percentage | Base size | Percentage | Base size | |
| Boys | 1593 | 75% | 1228 | 21.6% | 355 | 1.8% | 29 | 0.9% | 15 |
| Girls | 1660 | 74% | 1196 | 23.9% | 385 | 1.4% | 22 | 0.1% | 2 |
Problem gambling by age
Those aged 11 to 13 years old were more likely to be categorised as problem gamblers than those aged 14 to 16 years (1 percent compared to 0.3 percent) but not significantly more likely than 17 year olds at 0.5 percent. The base number for these groups falls below 50 so the results should be treated with caution.
Table 2: Types of gamblers by age (last 12 months)
Table 2 information
The numbers of individuals who fall into the categories of ‘at risk gamblers’ and ‘problem gamblers’ are low (below our threshold for analysis of 50 or more cases). As such these results should be treated with caution.
| Age | Total | Non-gambler | Non-problem gambler | At risk gambler | Problem gambler | ||||
|---|---|---|---|---|---|---|---|---|---|
| Base size | Percentage | Base size | Percentage | Base size | Percentage | Base size | Percentage | Base size | |
| 11 to 13 years old | 1584 | 73% | 1069 | 22.4% | 326 | 2.0% | 29 | 1.1% | 15 |
| 14 to 16 years old | 1566 | 75% | 1320 | 23.4% | 414 | 1.2% | 22 | 0.3% | 6 |
| 17 years old | 284 | 76% | 161 | 22.6% | 48 | 1.0% | 2 | 0.5% | 1 |
Problem gambling by ethnicity
Young people who define themselves as white were more likely to be identified as non-problem gamblers, using the youth adapted problem gambling screen Diagnostic and Statistical Manual of Mental Disorders 4th Edition – Multiple Response Juvenile (DSM-IV-MR-J), than those who are from a black or minority ethnic group (24.7 percent, compared with 17.3 percent). There are no statistically significant differences by ethnicity with regard to the prevalence of at risk or problem gamblers.
While this was also the case in 2022, the proportion of non-problem gamblers for those who define themselves as white has decreased (30.7 percent) yet remained comparable for those who are from a black or minority ethnic group (17.7 percent).
Table 3: Types of gamblers by ethnicity (last 12 months)
Table 3 information
The numbers of individuals who fall into the categories of ‘at risk gamblers’ and ‘problem gamblers’ are low (below our threshold for analysis of 50 or more cases). As such these results should be treated with caution.
| Ethnicity | Total | Non-gambler | Non-problem gambler | At risk gambler | Problem gambler | ||||
|---|---|---|---|---|---|---|---|---|---|
| Base size | Percentage | Base size | Percentage | Base size | Percentage | Base size | Percentage | Base size | |
| White | 2666 | 73% | 1915 | 24.7% | 653 | 1.6% | 42 | 0.5% | 12 |
| Black and/or other minority ethnic | 724 | 79% | 601 | 17.3% | 131 | 1.4% | 11 | 1.1% | 8 |
Experience of gambling
Summary
To set the findings in context, this report also provides information on young people’s wider experience of gambling, which is taking part in gambling but not necessarily with their own money.
Throughout this section we make comparisons to 2022 data. However, it should be noted that while the 2023 sample included year 12 pupils and independent schools, these were not included in the 2022 sample and therefore any differences between the two years are indicative only.
While almost half (48 percent) of young people have experience of some form of gambling, fewer (40 percent) have experienced gambling in the last 12 months, using their own or someone else’s money. Fewer young people have been actively involved in gambling (spending their own money on gambling), 13 percent were actively involved in gambling in the last four weeks and 5 percent in the last seven days.
The research highlights the gap between experience of gambling in the last 12 months and active involvement, notably for arcade gaming machines play; three in ten (30 percent) reported experience of play, but only two in ten (19 percent) spent their own money on doing so.
Overall gambling experience
In total, almost half (48 percent) of all 11 to 17 year olds have some experience of gambling, with two in five (40 percent) having experienced gambling in the last 12 months. This experience of gambling does not necessarily entail spending their own money. The proportion of young people who were actively involved with gambling (that is, spent their own money) in the last 12 months is 26 percent, decreasing to 13 percent in the last 4 weeks and 5 percent in the last seven days.
Experience of gambling within the last 12 months was more prevalent among those aged 11 to 13 years old (43 percent) than those aged 14 to 16 years old (37 percent), and 17 year olds (35 percent). Those who have experienced gambling in the last 12 months were also likely to be young people from white ethnic groups (42 percent) than young people from black and ethnic backgrounds (33 percent) and from Scotland than England or Wales (48 percent, compared to 39 percent and 34 percent). Those who had seen their family members gamble were also more likely to have experience of gambling in the last 12 months compared with those who had not (58 percent, compared to 42 percent), which could be a result of taking part in the gambling activity together.
Overall experience of gambling has seen a significant decrease in comparison to 2022, with a 10 percentage point decrease from 50 percent of young people who have had some experience of gambling over the last 12 months.
There has been a 7 percentage point decrease among those aged 11 to 13 years old, whose gambling was on par with those aged 14 to 16 years old in 2022 (both 50 percent), 14 to 16 year olds have since seen a decrease of 13 percentage points in experience of gambling. There continues to be a significant disparity between ethnic groups. Young people from white ethnic groups and those of black and ethnic minority backgrounds have each seen a decrease in comparison to 2022 in experience of gambling in the last 12 months (from 53 to 42 percent and 42 to 33 percent, respectively).
Figure 3: Wider experience and active involvement in gambling

Figure 3 information
Base: All 11 to 17 year olds answering (3,453).
Note: The chart shows results for different questions asked in the survey, so the responses shown will not add up to 100 percent.
| Wider experience and active involvement in gambling | Percentage (answers do not sum to 100 percent as chart shows more than one question) |
|---|---|
| Ever gambled | 48% |
| Gambled in last 12 months | 40% |
| Spent money on gambling in last 12 months | 26% |
| Spent money on gambling in last 4 weeks | 13% |
| Spent money on gambling in last 7 days | 5% |
Overall gambling experience in the last 12 months
The most popular gambling activity in the past 12 months that young people have experienced was arcade gaming machines (for example, penny pusher or claw grab machine), mentioned by three in ten (30 percent) young people, followed by placing a bet for money between friends or family, at 15 percent. Just under one in ten (7 percent) of young people had experienced gambling by playing cards for money in the same time period or by playing bingo somewhere other than a bingo club.
Young people were more likely to experience gambling in a regulated environment (33 percent), than playing unregulated forms of gambling (22 percent), largely due to the high proportion who reported playing arcade gaming machines. When excluding those who reported playing arcade gaming machines, 16 percent of young people experienced gambling in a regulated environment.
Figure 4 illustrates the proportion of young people who have experience of gambling over the last 12 months, listing the ten most common types of activity, and the variations between experience and active involvement (that is, the activities young people spent their own money on).
The biggest disparity between activities young people have experienced and those they have spent money on in the last 12 month is for arcade gaming machines. Three in ten (30 percent) report experience of this in the last 12 months but this drops to two in ten (19 percent) for those who have spent their own money on this activity.
Similarly, experience of playing bingo somewhere other than a bingo club is higher (7 percent) than active involvement; 1 percent reported spending their own money which could indicate that young people tend to play bingo for fun, rather than for money, or that they may be spending someone else’s money to play. When it comes to playing cards for money, however, whilst a relatively small proportion of young people are taking part in this activity (7 percent), a similar proportion are spending their own money when they do so (5 percent).
Gambling on regulated forms of gambling has seen a 5 percentage point decrease from 38 to 33 percent since 2022, while unregulated environments have seen an 8 percentage point decrease from 30 percent in 2022 to 22 percent in 2023. The disparity between activities young people engage in and those that they have spent their own money on is reflective of the trends of 2022, there has however been a 5 percentage point decrease in young people with experience playing arcade games (35 percent in 2022 to 30 percent in 2023).
Figure 4: Activities that are tried versus those that money is spent on – top ten activities experienced in the last 12 months, compared with active involvement

Figure 4 information
Column 1 of data: GAMSPENDWHEN. When did you last do [this activity or these activities]? Was it in the last 12 months?
Column 2 of data: GAMSPEND4 And when did you last spend money on [this activity or these activities]? In the last 12 months.
Base: All 11 to 17 year olds answering (3,453).
Note: This is a multiple response question, therefore answers do not sum to 100 percent.
| Experience of Gambling (multiple response question, therefore answers do not sum to 100 percent) | Active Involvement (multiple response question, therefore answers do not sum to 100 percent) | Active Involvement (multiple response question, therefore answers do not sum to 100 percent) |
|---|---|---|
| Played arcade gaming machines | 30% | 19% |
| Placed a bet for money between friends or family | 15% | 11% |
| Played cards for money | 7% | 5% |
| Played bingo at somewhere other than a bingo club | 7% | 1% |
| National Lottery scratchcards | 6% | 1% |
| Played fruit or slot machines | 6% | 3% |
| Placed a bet on a betting website and/or app | 2% | 1% |
| Placed a bet at a betting shop or bookies | 2% | 1% |
| National Lottery draw | 2% | 1% |
| Played bingo online | 2% | 0% |
Variations in gambling experience
Looking at the different gambling activities, across most activities there were few notable differences for age and gender, except for the proportion of 11 to 13 year olds who were more likely to report experience of arcade games such as penny pushers or claw grab machines than young people aged 14 to 16 years old and 17 year olds (33 percent, compared to 28 percent and 25 percent, respectively).
Those who had seen family members gamble were more likely to have experienced most forms of gambling activities in the last 12 months, compared to young people who had not seen their family gamble. This mirrors the rates for active involvement in gambling in the last 12 months; with the differences most notable for activities where family members would be present such as placing a bet with friends or family (28 percent, compared with 13 percent of those who had not seen family members gamble).
Differences by ethnicity are only notable in the higher rates of experience of arcade gaming machines: 32 percent of white 11 to 17 year olds, compared with 24 percent of young people from black and ethnic minority groups. The activity of placing a bet for money between friends and family is also more prevalent amongst young people who define their ethnicity as white (16 percent) than young people from black and ethnic minority backgrounds (12 percent).
Reflecting on the different types of gambling activities young people engaged with in 2022, there has been a 6 percentage point decrease in those playing arcade games for 14 to 16 year olds (34 percent in 2022).
The disparity between ethnic groups of experience of arcade games is reflective of the trends of 2022, there has however been a decrease in prevalence for those from white ethnic groups (6 percentage point decrease from 38 percent).
The Impact of gambling on young people
Summary
This section of the report examines the impacts experienced by young people as a result of their own or someone else’s gambling. This is the second time the data has been collected following a pilot study in 2019 entitled Measuring gambling-related harms among children and young people: A framework for action (opens in new tab) and an initial data collection in 2022 in the Young People and Gambling report 2022. We will continue to develop our use of this data to build a fuller understanding of the impact of gambling on young people, particularly the extent and severity of gambling-related harms that they may experience. This development work will include analysing the data for young people defined as problem gamblers, which has been excluded from the current report due to the low base sizes.
Throughout this section we make comparisons to 2022 data. However, it should be noted that while the 2023 sample included year 12 pupils and independent schools, these were not included in the 2022 sample and therefore any differences between the two years are indicative only.
One in ten (10 percent) young people said that their own gambling had led them to talk to their parents about how they felt, either sometimes, often, or all of the time. A similar proportion (6 percent) stated that it had made them feel uncomfortable around their friends (such as feeling embarrassed, or feeling friends would not approve).
For the vast majority, gambling does not lead to feelings of guilt or sadness. However, they are less clear on whether gambling makes them feel happy; just under one in five (17 percent) agree, but three in ten (29 percent) disagree and a similar proportion (26 percent) are unsure either way.
Only a minority of young people who spent their own money on gambling said that it helped to buy the things that they needed (10 percent) at least some of the time, but fewer still said that it stopped them buying the things that they wanted (5 percent) at least some of the time. Just 3 percent stated that their own gambling made it hard for them to put effort into their schoolwork, homework, or personal studies.
Across the last 12 months, 3 percent of young people who were actively involved in gambling had lost sleep at night at least some of the time because gambling meant that they went to bed late. While 4 percent lost sleep at least some of the time because they were worried about a family member or someone that is responsible for them gambling.
Almost three in ten (28 percent) young people had ever seen the family members they lived with gamble. The most common impact being that it helped to pay for things or activities for example holidays, trips, clubs (mentioned by 12 percent). However, one in ten of those who had seen family members gamble felt that at some point it had resulted in arguments or tension at home (10 percent) or that it had impacted on the time parents or guardians had to spend with them (7 percent). A smaller proportion of those who had seen family members gamble stated that it had impacted on the availability of food at home or money on their school canteen card or account (3 percent).
There were some interesting contrasts by gender, with boys more likely than girls to feel guilty when they gamble and more likely to have seen family members gamble. Girls were less likely than boys to say that they worried about their gambling.
How gambling impacts on relations with friends and family
Young people who had spent their own money on gambling in the last 12 months were asked how gambling had impacted on their relationship with their friends and family. Throughout this section a combination figure for ‘sometimes’, ‘often’, or ‘all of the time’ has been used to the report the impact that gambling can have, unless specified otherwise.
Just over one in ten young people (10 percent) said that their own gambling had led them to talk to their parents about how they felt at least sometimes. Five percent of all young people said it had happened all of the time
Just over one in twenty (6 percent) 11 to 17 year olds who were actively involved with gambling in the last 12 months stated that gambling had made them uncomfortable around their friends, such as feeling embarrassed or feeling friends would not approve, at least sometimes. Just 2 percent felt uncomfortable all the time.
Figure 5: The impact that young people’s gambling has on family and friends
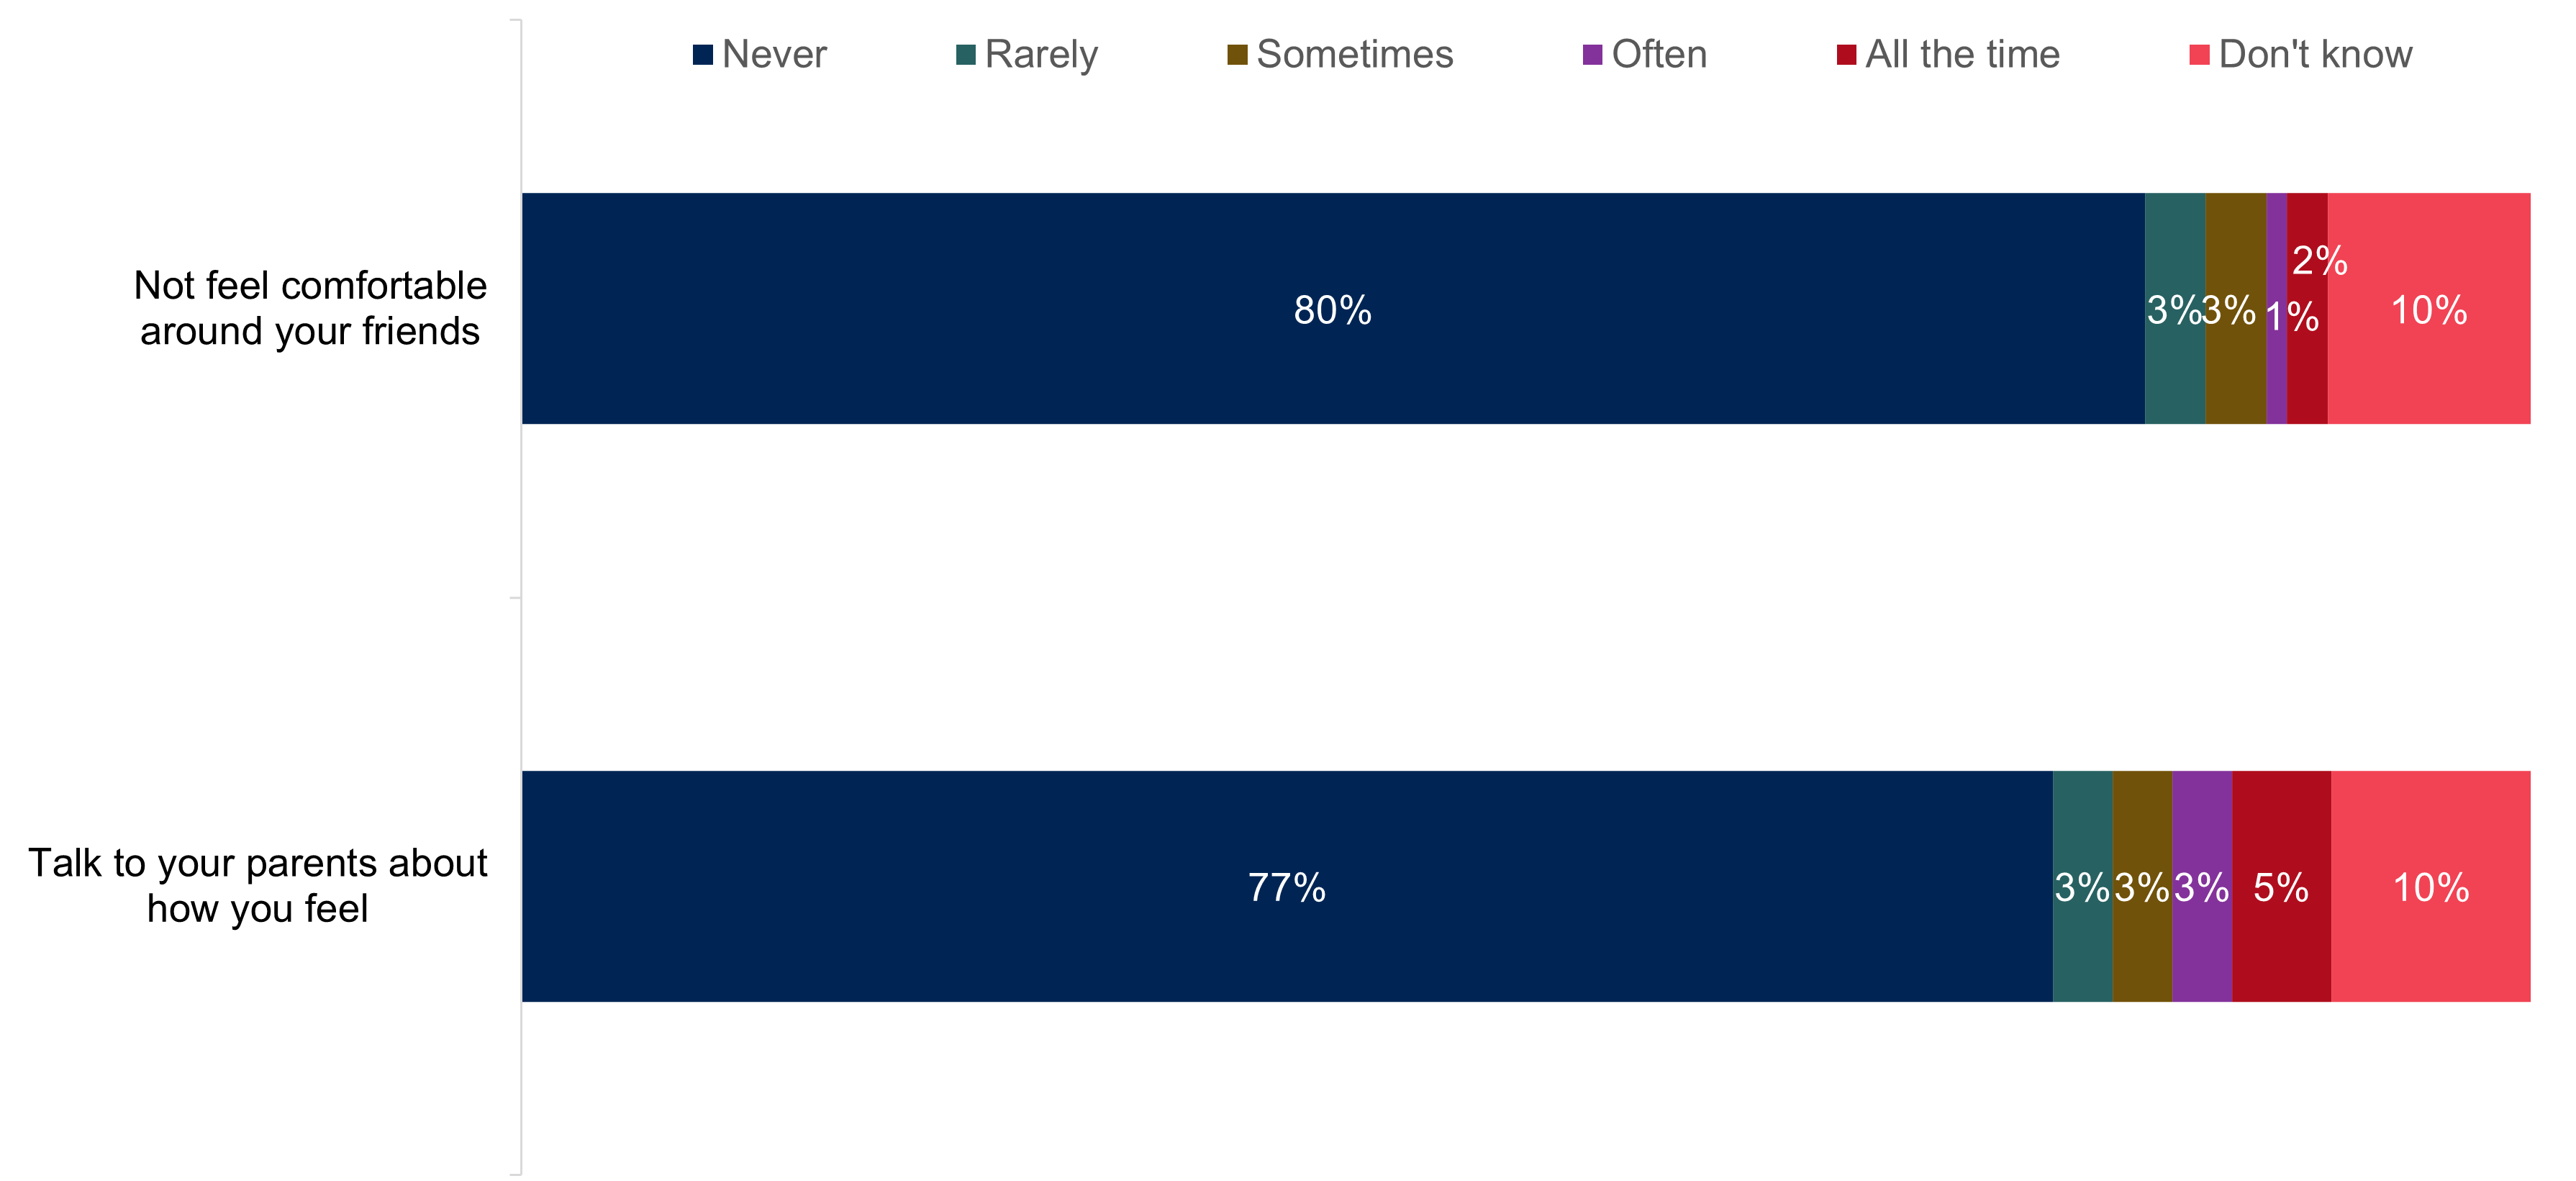
Figure 5 information
GA_GAMLEDTLK GA_GAMLEDCOM. Thinking about the last 12 months, how often, if at all, has your own gambling led you to...
Base: All 11 to 17 year olds answering who have spent their own money gambling in the last 12 months 'Talk to your parents about how you feel' (817). 'Not feel comfortable around your friends' (813).
| The impact that young people’s gambling has on family and friends | Percentage who never | Percentage who rarely | Percentage who sometimes | Percentage who often | Percentage who all the time | Percentage who don't know |
|---|---|---|---|---|---|---|
| Not feel comfortable around friends (such as feeling embarrassed, or feeling friends would not approve) | 80% | 3% | 3% | 1% | 2% | 10% |
| Talk to your parents about how you feel | 77% | 3% | 3% | 3% | 5% | 10% |
Those young people defined as ‘at risk’ by the youth adapted problem gambling screen Diagnostic and Statistical Manual of Mental Disorders 4th Edition - Multiple Response Juvenile (DSM-IV-MR-J) were significantly more likely than all responders and those deemed to be ‘non-problem’ gamblers to talk to their parents about how they feel. However, due to a low sample size for these groups this is indicative only.
There were no other significant differences by age, gender and ethnicity.
Those young people defined as ‘at risk’ were significantly more likely than all responders and those deemed to be ‘non-problem’ gamblers to say that gambling had made them uncomfortable around their friends (22.6 percent compared to 4.2 percent of ‘non problem’ gamblers). The latter group were significantly more likely to say that gambling never made them feel uncomfortable around their friends. However, again due to small base sizes findings for those ‘at risk’ are indicative only.
Further, those aged 13 years old were more likely than all respondents to say that gambling made them uncomfortable around their friends (10 percent compared to 6 percent).
How gambling makes young people feel
Young people who had spent their own money on gambling in the last 12 months were asked how it affected their happiness, and whether it ever made them feel sad or guilty.
For the majority, their involvement in gambling does not lead to feelings of guilt or sadness: only 4 percent agreed with the statement ‘I feel sad when I gamble’ and only 6 percent agreed with the statement ‘I feel guilty when I gamble’. They are less clear on whether gambling makes them feel happy; just under one in five (17 percent) agree, but three in ten (29 percent) disagree and a similar proportion (26 percent) are unsure either way.
Figure 6: How gambling makes young people feel
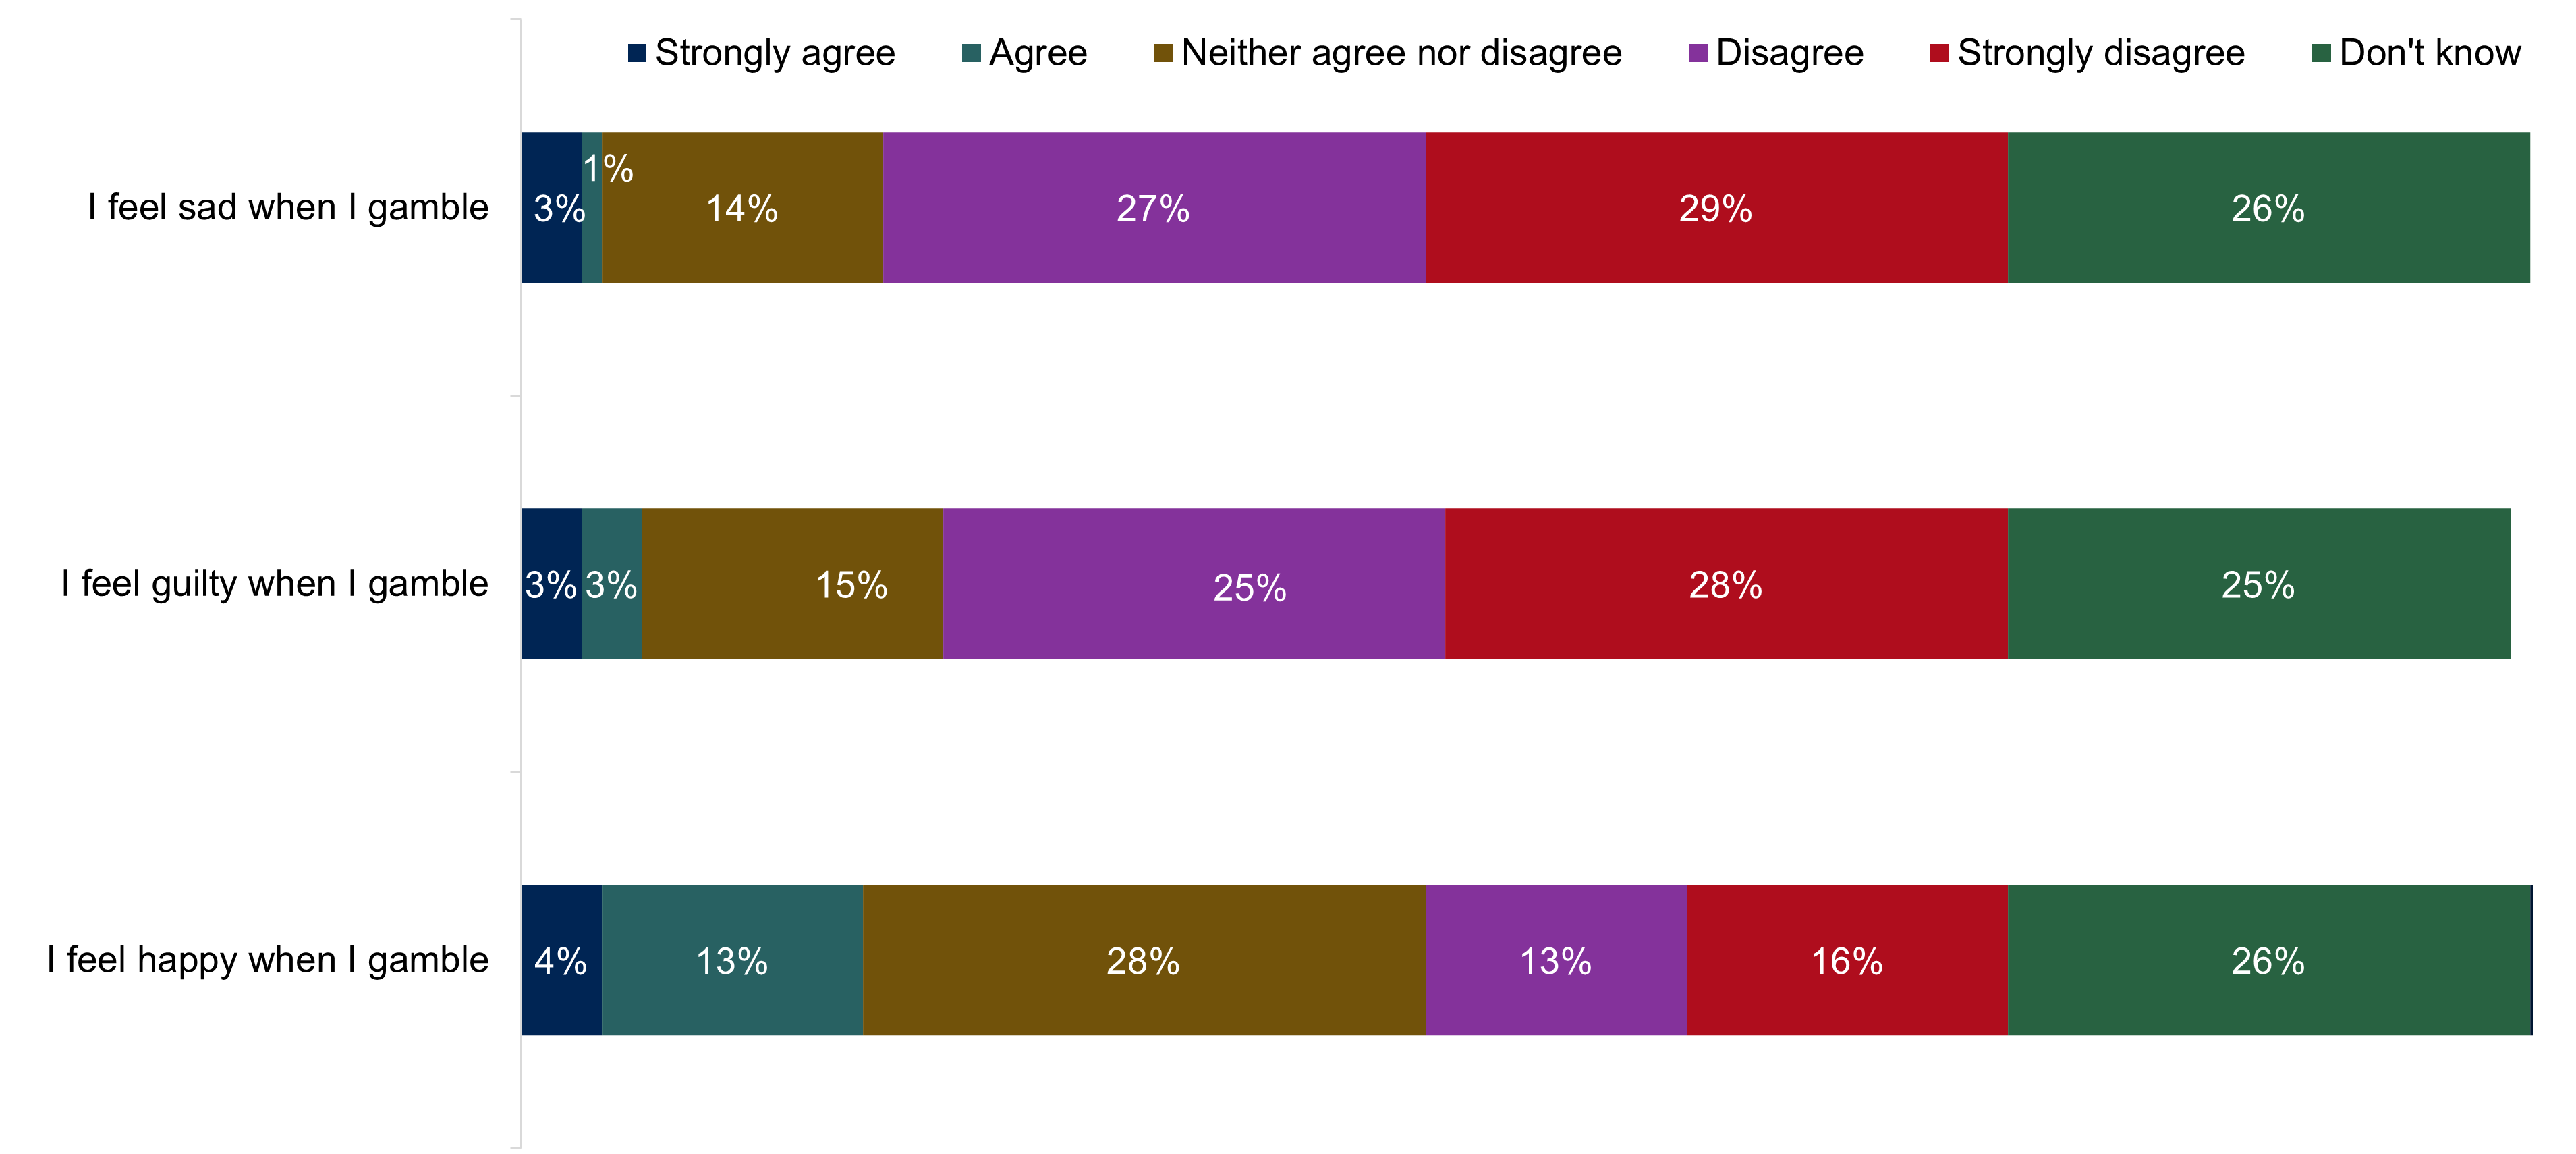
Figure 6 information
GC_EXPHAP GC_EXPGUIL GC_EXPSAD. Thinking about your experiences of gambling, how much do you agree or disagree with the following statements?
Base: All 11 to 17 year olds answering who have spent their own money gambling in the last 12 months 'I feel happy when I gamble' (805). 'I feel guilty when I gamble' (802). 'I feel sad when I gamble' (803).
| How gambling makes young people feel | Percentage who strongly agree | Percentage who agree | Percentage who neither agree nor disagree | Percentage who disagree | Percentage who strongly disagree | Percentage who don't know |
|---|---|---|---|---|---|---|
| I feel sad when I gamble | 3% | 1% | 14% | 27% | 29% | 26% |
| I feel guilty when I gamble | 3% | 3% | 15% | 25% | 28% | 25% |
| I feel happy when I gamble | 4% | 13% | 28% | 13% | 16% | 26% |
Those young people in the ‘at risk’ group were significantly more likely than all responders and those deemed to be ‘non-problem gamblers’ to agree that gambling makes them happy (32 percent compared to 17 percent and 14 percent respectively).
This year, the ‘at risk’ group were also more likely than ‘non-problem’ gamblers to disagree that gambling makes them feel sad (69 percent compared to 54 percent).
Those aged 13 years old were more likely to disagree with the statements that they feel happy when they gamble (35 percent compared to 29 percent) and that they feel sad when they gambled, compared to all respondents (62 percent compared to 55 percent) and those in a slightly younger age group (62 percent compared to 50 percent of 12 year olds). Respondents aged 13 were also more likely than all other respondents to disagree that they felt guilty when they gamble (60 percent compared to 54 percent).
Boys were more likely than girls to agree that gambling makes them feel guilty (10 percent compared to 2 percent). However, this pattern was not apparent in 2022. While the proportion for girls has remained constant since 2022, the proportion of boys who agreed that gambling makes them feel guilty has increased by 5 percentage points from 5 percent in 2022.
There was no difference by ethnicity.
The impact of gambling on sleep
Over half of young people (59 percent) report experiencing a loss of sleep due to worrying about something over the past year (not including gambling). Girls were significantly more likely than boys to say that they lost sleep due to worrying about something (70 percent compared to 46 percent).
However, a minority of young people who were actively involved in gambling had lost sleep at night because gambling meant that they went to bed late (3 percent) or because they were worrying about their own gambling (2 percent) either all of the time, often or sometimes.
The survey results indicate that 4 percent of all 11 to 17 year olds we surveyed lost sleep because they were worried about a family member, or someone that is responsible for them, gambling.
Figure 7: The impact of gambling on sleep
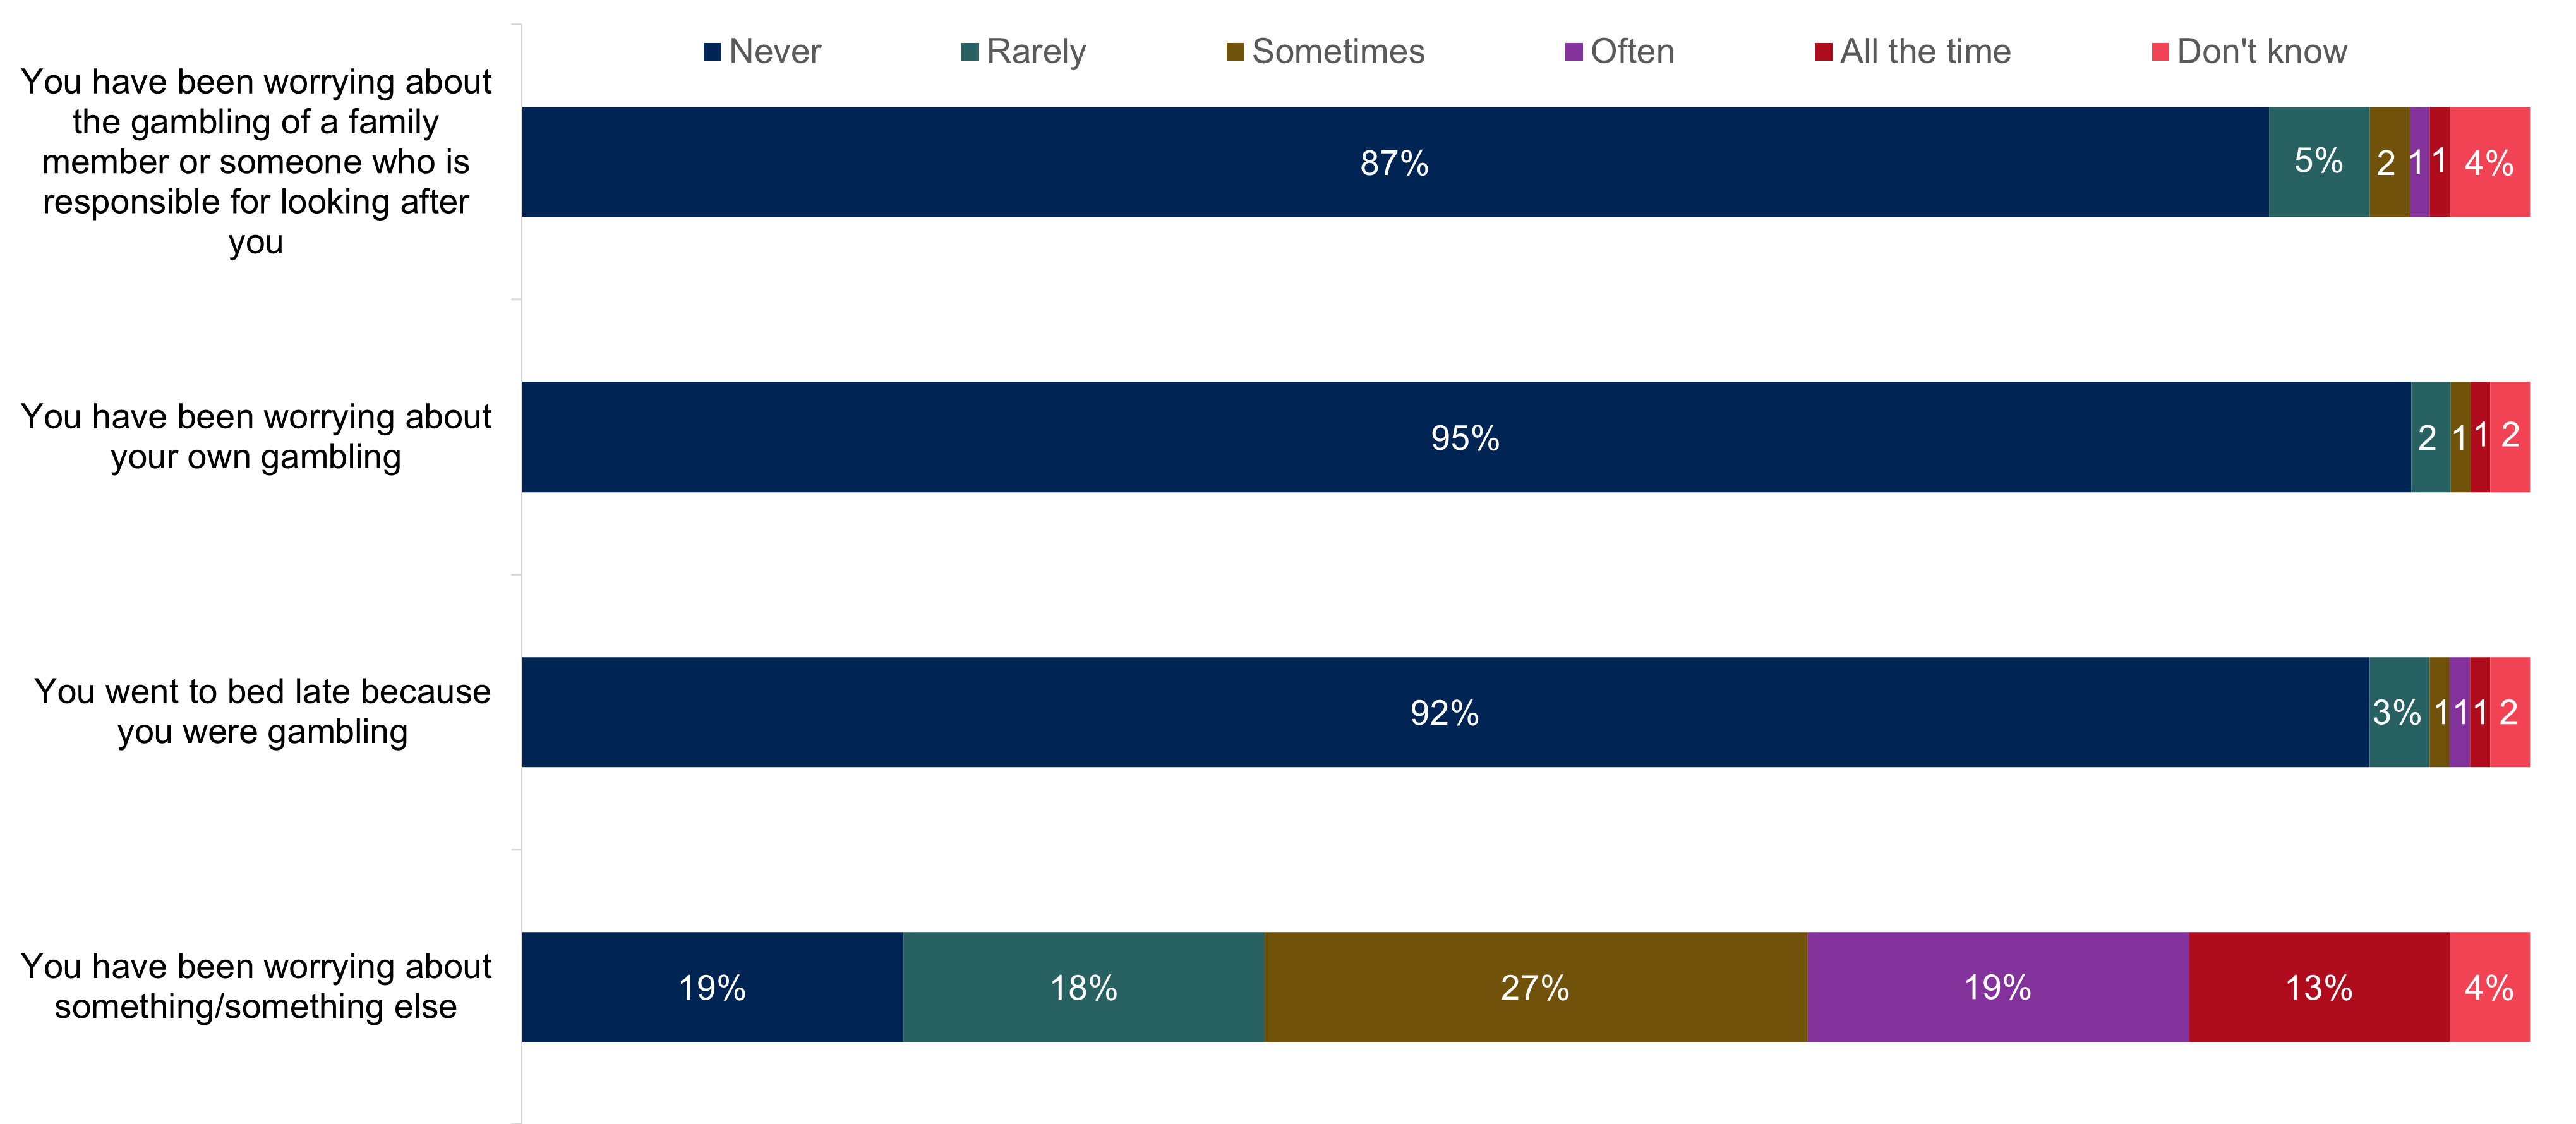
Figure 7 information
GC_SLEEPLATE GC_SLEEPWRYGAM GC_SLEEPWRYELSE GC_SLEEPFAMGAM. Over the past year, how often, if at all, have you lost sleep at night because…
Base: All 11 to 17 year olds answering, 'You have been worrying about the gambling of a family member or someone who is responsible for looking after you' (2,614).
Base: All 11 to 17 year olds answering who have spent their own money gambling in the last 12 months answering, 'You have been worrying about your own gambling' (854).
Base: All 11 to 17 year olds answering who have spent their own money gambling in the last 12 months answering, 'You went to bed late because you were gambling' (851).
Base: All 11 to 17 year olds answering, 'You have been worrying about something or something else' (2,808).
| The impact of gambling on sleep | Percentage who never | Percentage who rarely | Percentage who sometimes | Percentage who often | Percentage who all the time | Percentage who don't know |
|---|---|---|---|---|---|---|
| You have been worrying about the gambling of a family member or someone who is responsible for looking after you | 87% | 5% | 2% | 1% | 1% | 4% |
| You have been worrying about your own gambling | 95% | 2% | 1% | 0% | 1% | 2% |
| You went to bed late because you were gambling | 92% | 3% | 1% | 1% | 1% | 2% |
| You have been worrying about something (something else) | 19% | 18% | 27% | 19% | 13% | 4% |
‘Non-problem’ gamblers were more likely than ‘at risk’ gamblers to say that they ‘never’ or ‘rarely’ went to bed late because of gambling (97 percent compared to 82 percent).
Conversely, ‘at risk’ gamblers were more likely than 'non-problem' gamblers to say that they went to bed late due to gambling ‘all the time or often’ (11 percent compared to 0.4 percent). ‘At risk gamblers were also more likely than ‘non-problem’ gamblers to say that they lost sleep due to worrying about their gambling ‘all of the time/often’ (2 percent compared to less than 1 percent).
Girls were more likely than boys to say they lost sleep due to worrying about their gambling rarely or never (99 percent compared to 95 percent) while those from black and minority ethnic groups were more likely than those who define their ethnicity as white to say that they lost sleep due to worrying about their gambling (5 percent compared to 1 percent).
Those aged 13 years old were more likely than all respondents to say they had lost sleep due to worrying about a family members gambling (7 percent compared to 4 percent).
The impact of gambling on spending
Figure 8: The impact of gambling on spending
Young people who actively gambled in the last 12 months were asked if their own gambling had stopped them buying things that they wanted or, conversely, helped them to buy things that they needed.
Reflecting the perceived impact on households of family members gambling, as discussed in the next section, young people were most likely to highlight that gambling had helped them to buy things that they needed either all of the time, often or sometimes (10 percent). They were less likely to say that their own gambling stopped them from buying things that they wanted (5 percent).
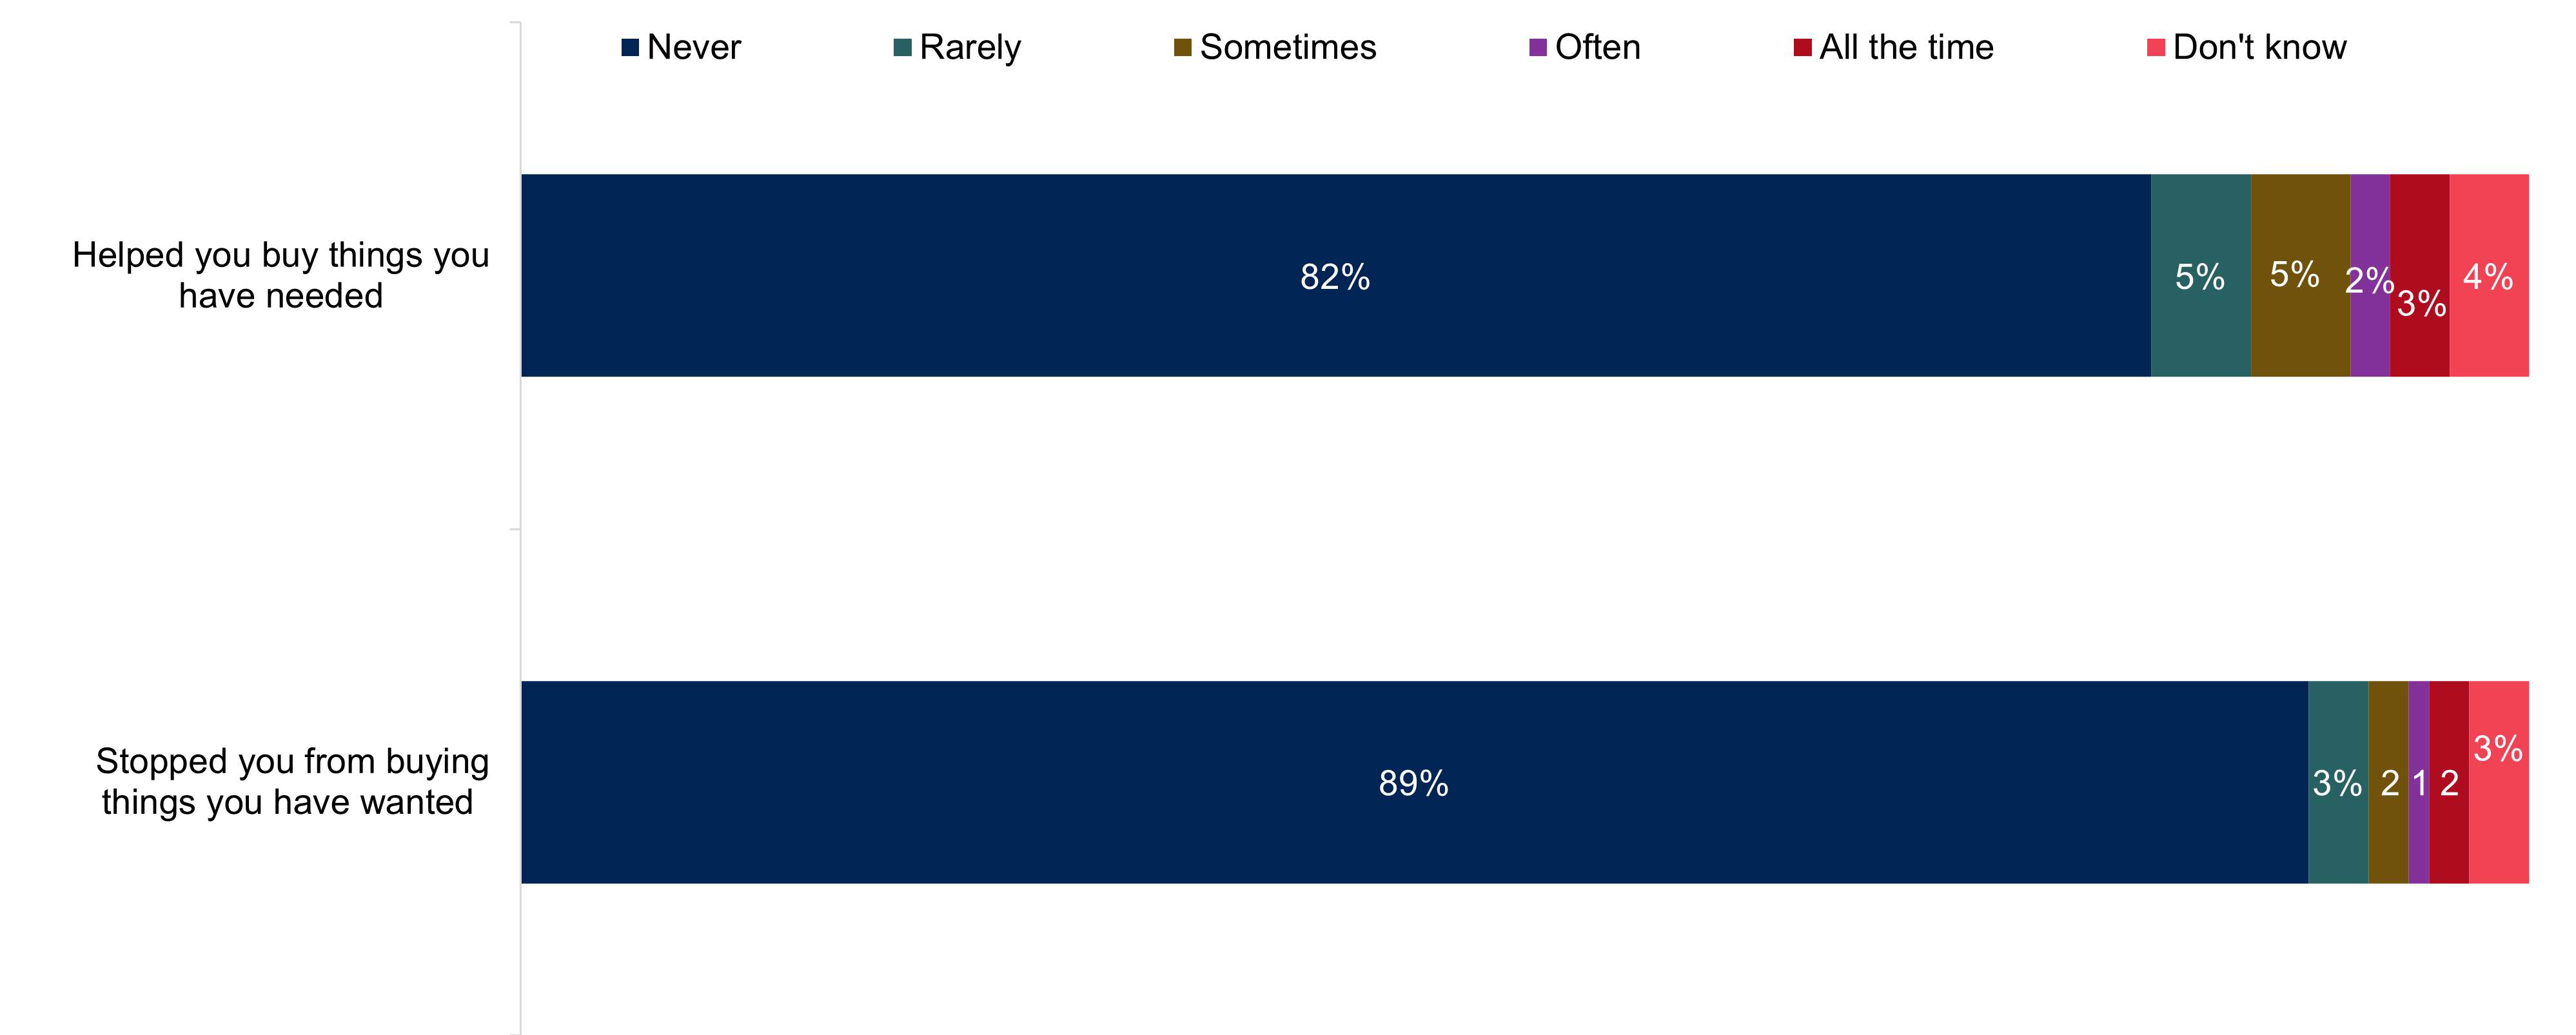
Figure 8 information
GC_GAMBSTBUY GC_GAMBHPBUY. Thinking about the last 12 months, how often, if at all, has your own gambling led to any of the following things?
Base: All 11 to 17 year olds answering who have spent their own money gambling in the last 12 months 'Stopped you from buying things you have want' (850). 'Helped you buy things you have needed' (850).
| The impact of gambling on spending | Percentage who never | Percentage who rarely | Percentage who sometimes | Percentage who often | Percentage who all the time | Percentage who don't know |
|---|---|---|---|---|---|---|
| Helped you buy things you have needed | 82% | 5% | 5% | 2% | 3% | 4% |
| Stopped you from buying things you have wanted | 89% | 3% | 2% | 1% | 2% | 3% |
Those in the ‘at risk’ group were more likely than ‘non-problem’ gamblers to say that their own gambling stopped them from buying things that they wanted (24 percent compared to 2 percent) and that gambling had helped them to buy the things that they needed (36 percent compared to 7 percent).
Girls were more likely than boys to say that gambling had never helped them to buy the things that they needed (86 percent compared to 78 percent). This pattern was not seen last year. This is because, while the proportion for boys has remained constant, for girls the proportion has increased (from 80 percent in 2022).
The impact of gambling on schoolwork
The survey also explored the potential impact of gambling on schoolwork, homework or personal studies. Less than one in twenty young people who were actively involved in gambling felt that it made it hard for them to put effort into their work or study either sometimes, often or all of the time (4 percent).
Those in the ‘at risk’ group were more likely to feel this way than those categorised as ‘non-problem’ gamblers (12 percent compared to 2 percent).
Figure 9: The impact of gambling on schoolwork
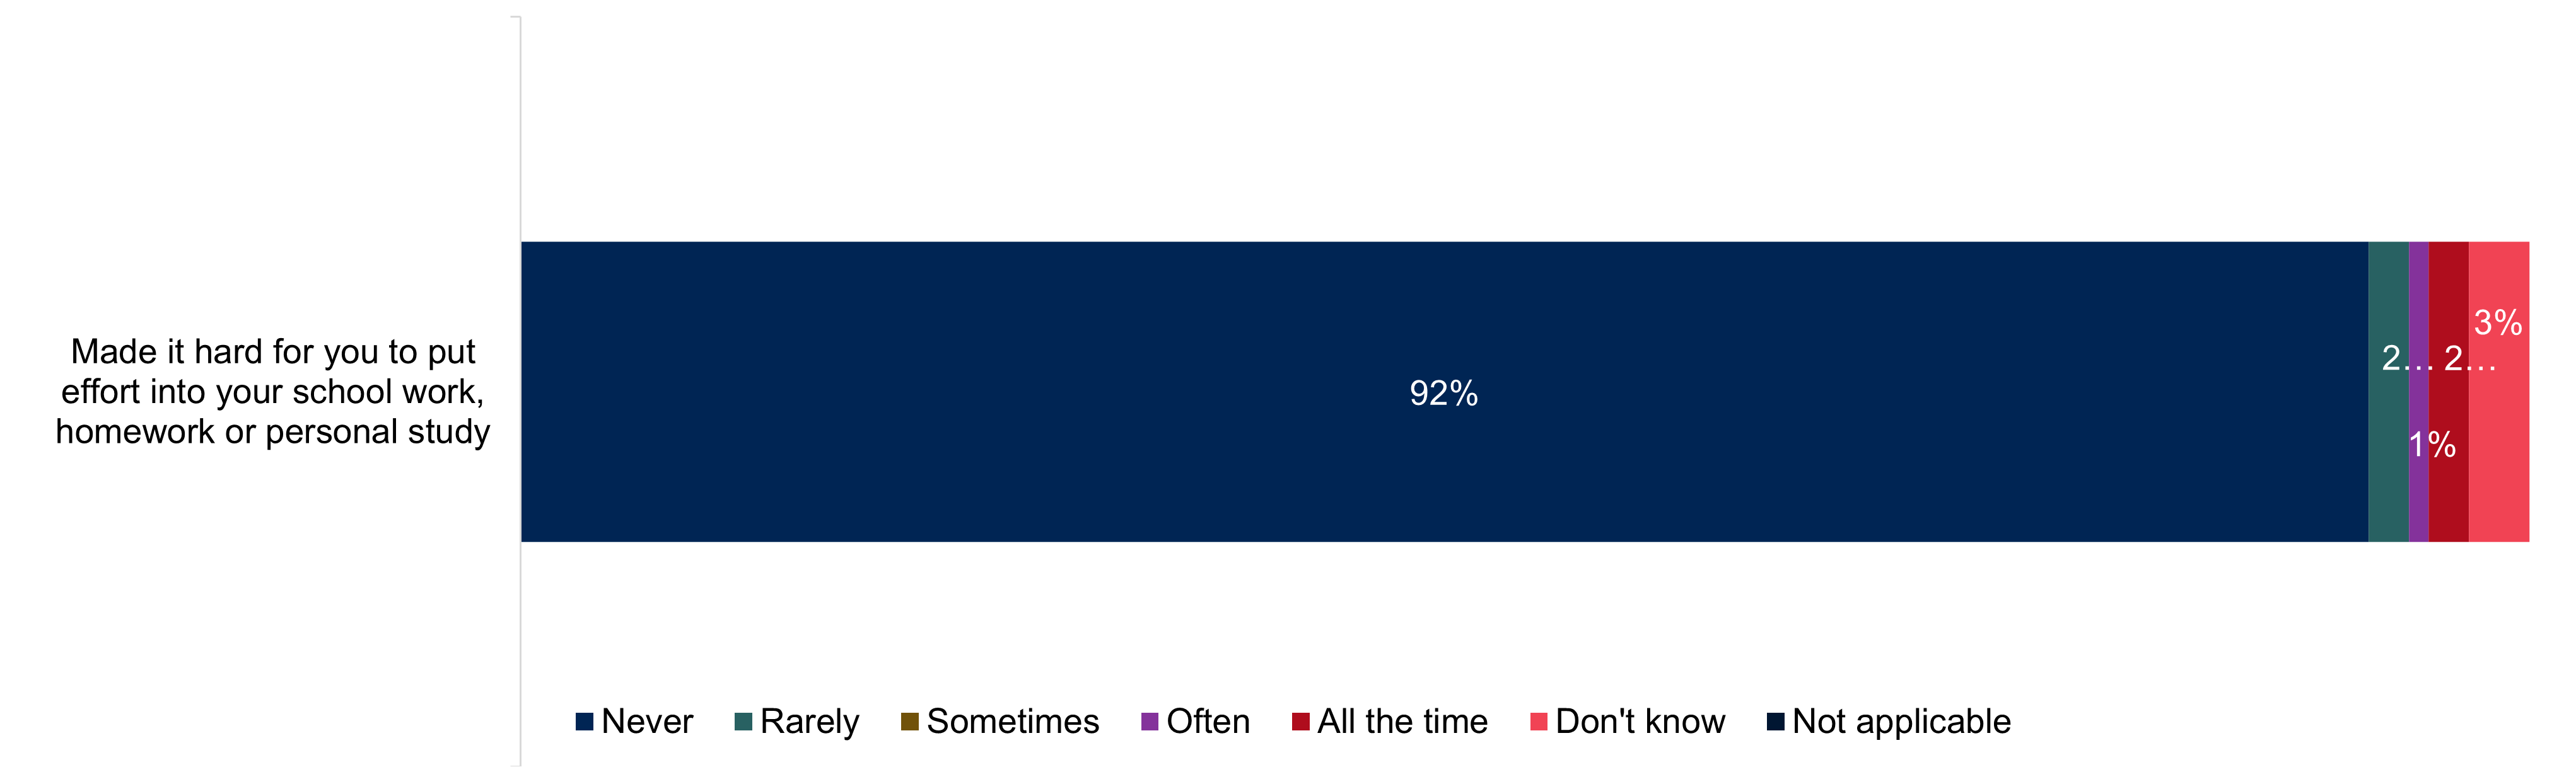
Figure 9 information
GC_HARDEFF. Thinking about the last 12 months, how often, if at all, has your own gambling led to any of the following things?
Base: All 11 to 17 year olds answering who have spent their own money gambling in the last 12 months 'Made it hard for you to put effort into your school work, homework or personal study' (852).
| The impact of gambling on schoolwork | Percentage who never | Percentage who rarely | Percentage who sometimes | Percentage who often | Percentage who all the time | Percentage who don't know |
|---|---|---|---|---|---|---|
| Made it hard for you to put effort into your school work, homework or personal study | 92% | 2% | 0% | 1% | 2% | 3% |
Experience and impact of family members’ gambling
A significant proportion of 11 to 17 year olds (28 percent) have seen family members they live with gamble. However, almost three in five (58 percent) have not.
Figure 10: Experience of ever seeing family members gambling
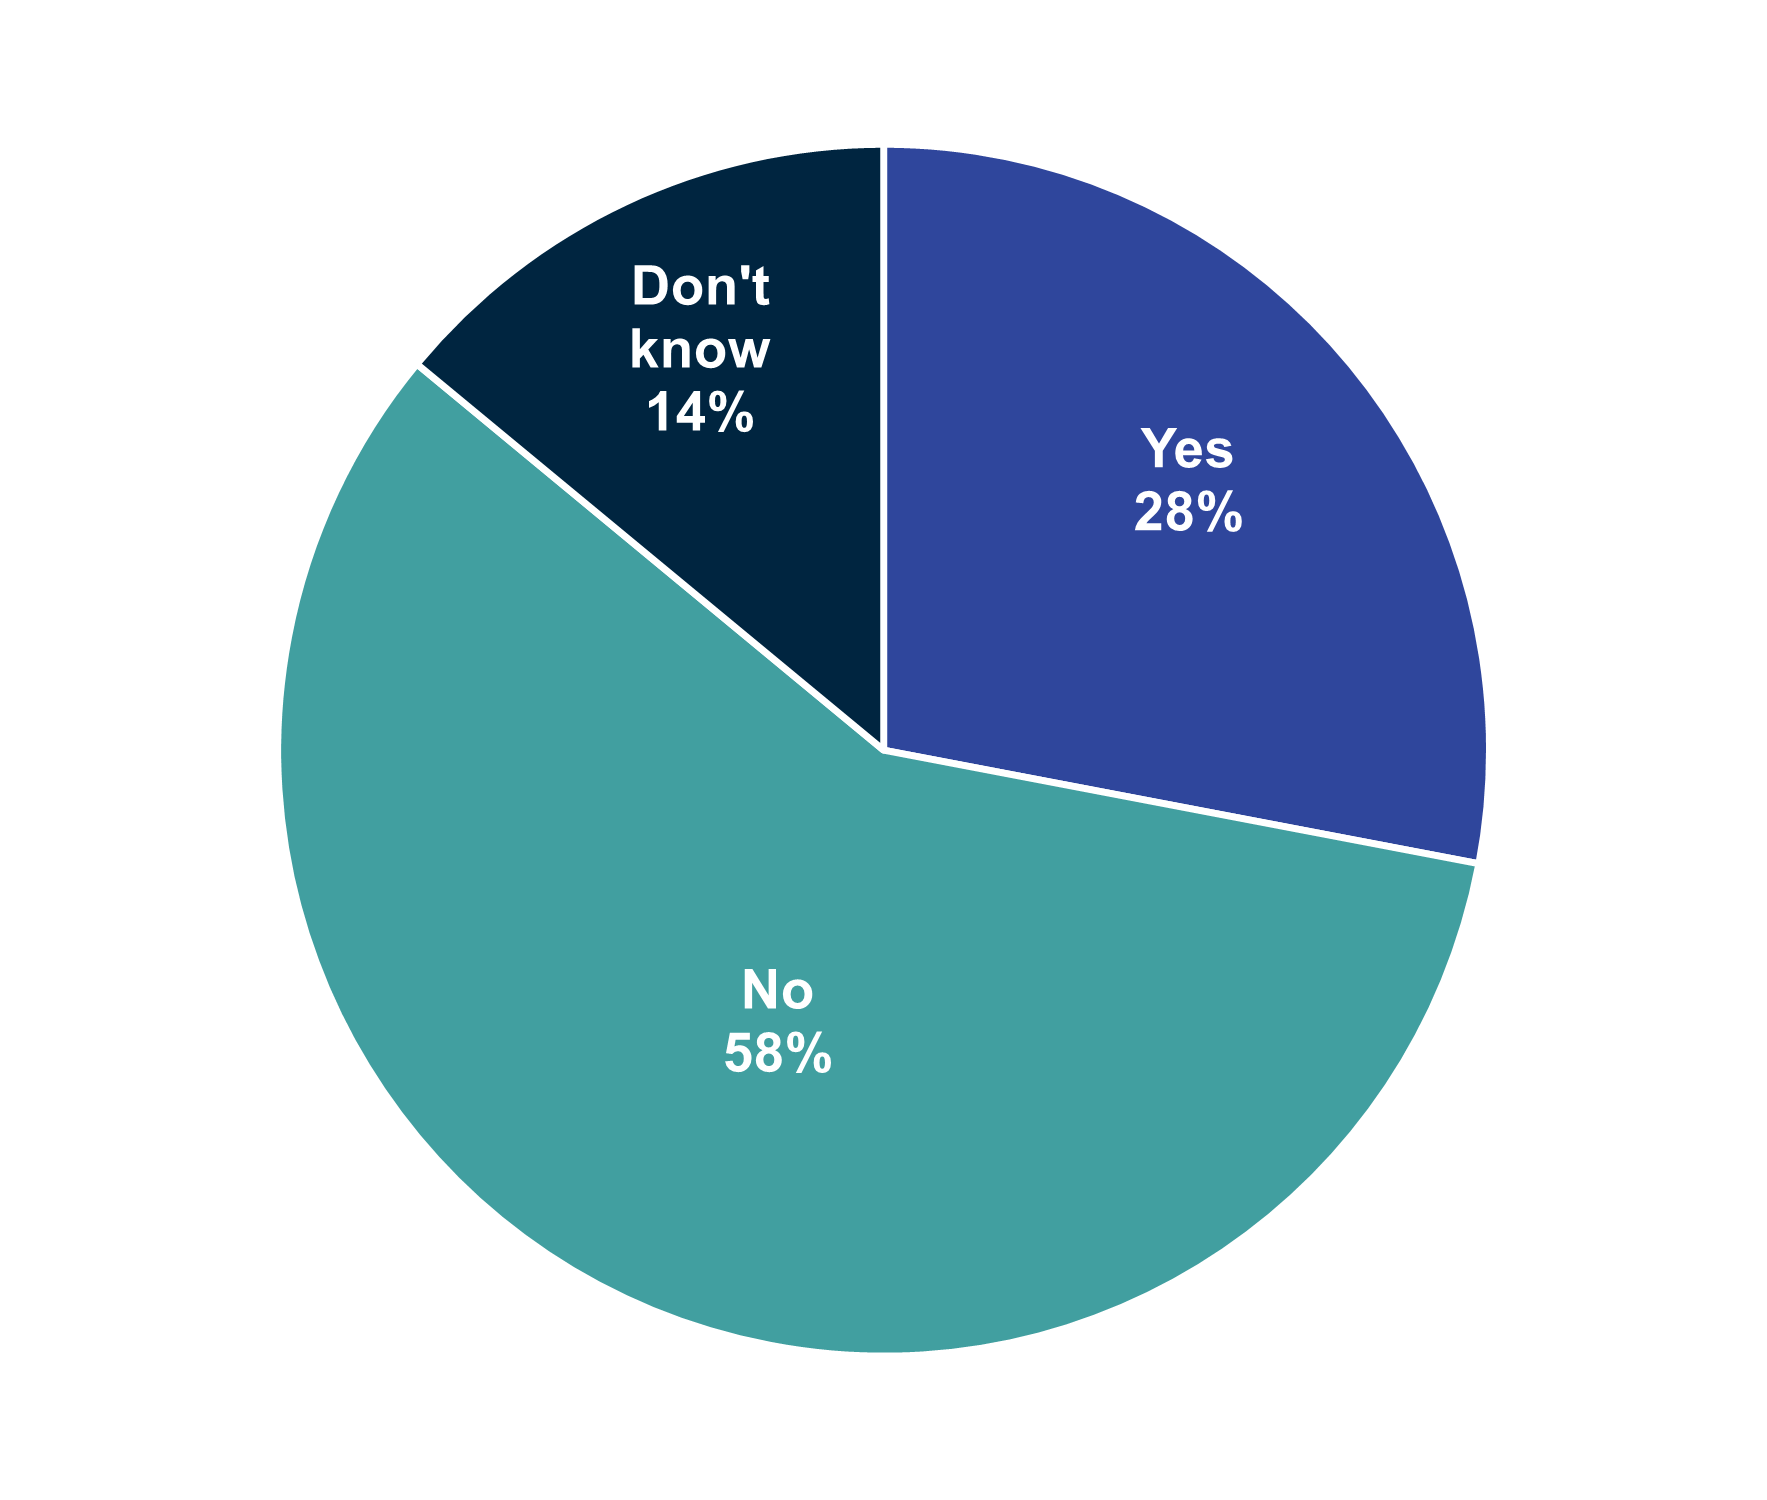
Figure 10 information
GC_FAMGAM. Have you ever seen any of the family members that you live with gambling? When we talk about gambling, we mean any activity which involves risking money (or something of value) in a game or a bet in the hope of winning money or a prize.
Base: All 11 to 17 year olds answering (2,781).
| Experience of family members gambling | Percentage |
|---|---|
| Yes | 28% |
| No | 58% |
| Don't know | 14% |
Boys were more likely than girls to have seen their family members gamble (30 percent compared to 24 percent).
Young people who had ever seen family members gamble were asked if this had affected specific aspects of their lives either sometimes, often, all of the time or never. A combination figure for ‘sometimes’, ‘often’, or ‘all of the time’ has been used to the report the impact that gambling can have, unless specified otherwise.
The most common impact of gambling by a family member, as shown in Figure 11, was that it helped to pay for other things or activities for example holidays, trips, clubs, just over one in ten (12 percent) said that this happened either sometimes, often, or all of the time.
Family members gambling impacted less on parents or guardians having time to spend with young people (7 percent) or the availability of food at home or money on school canteen card or account (mentioned by 3 percent). However, 9 percent of young people felt that it had resulted in more arguments or tension at home.
Figure 11: The impact that family members’ gambling can have on young people
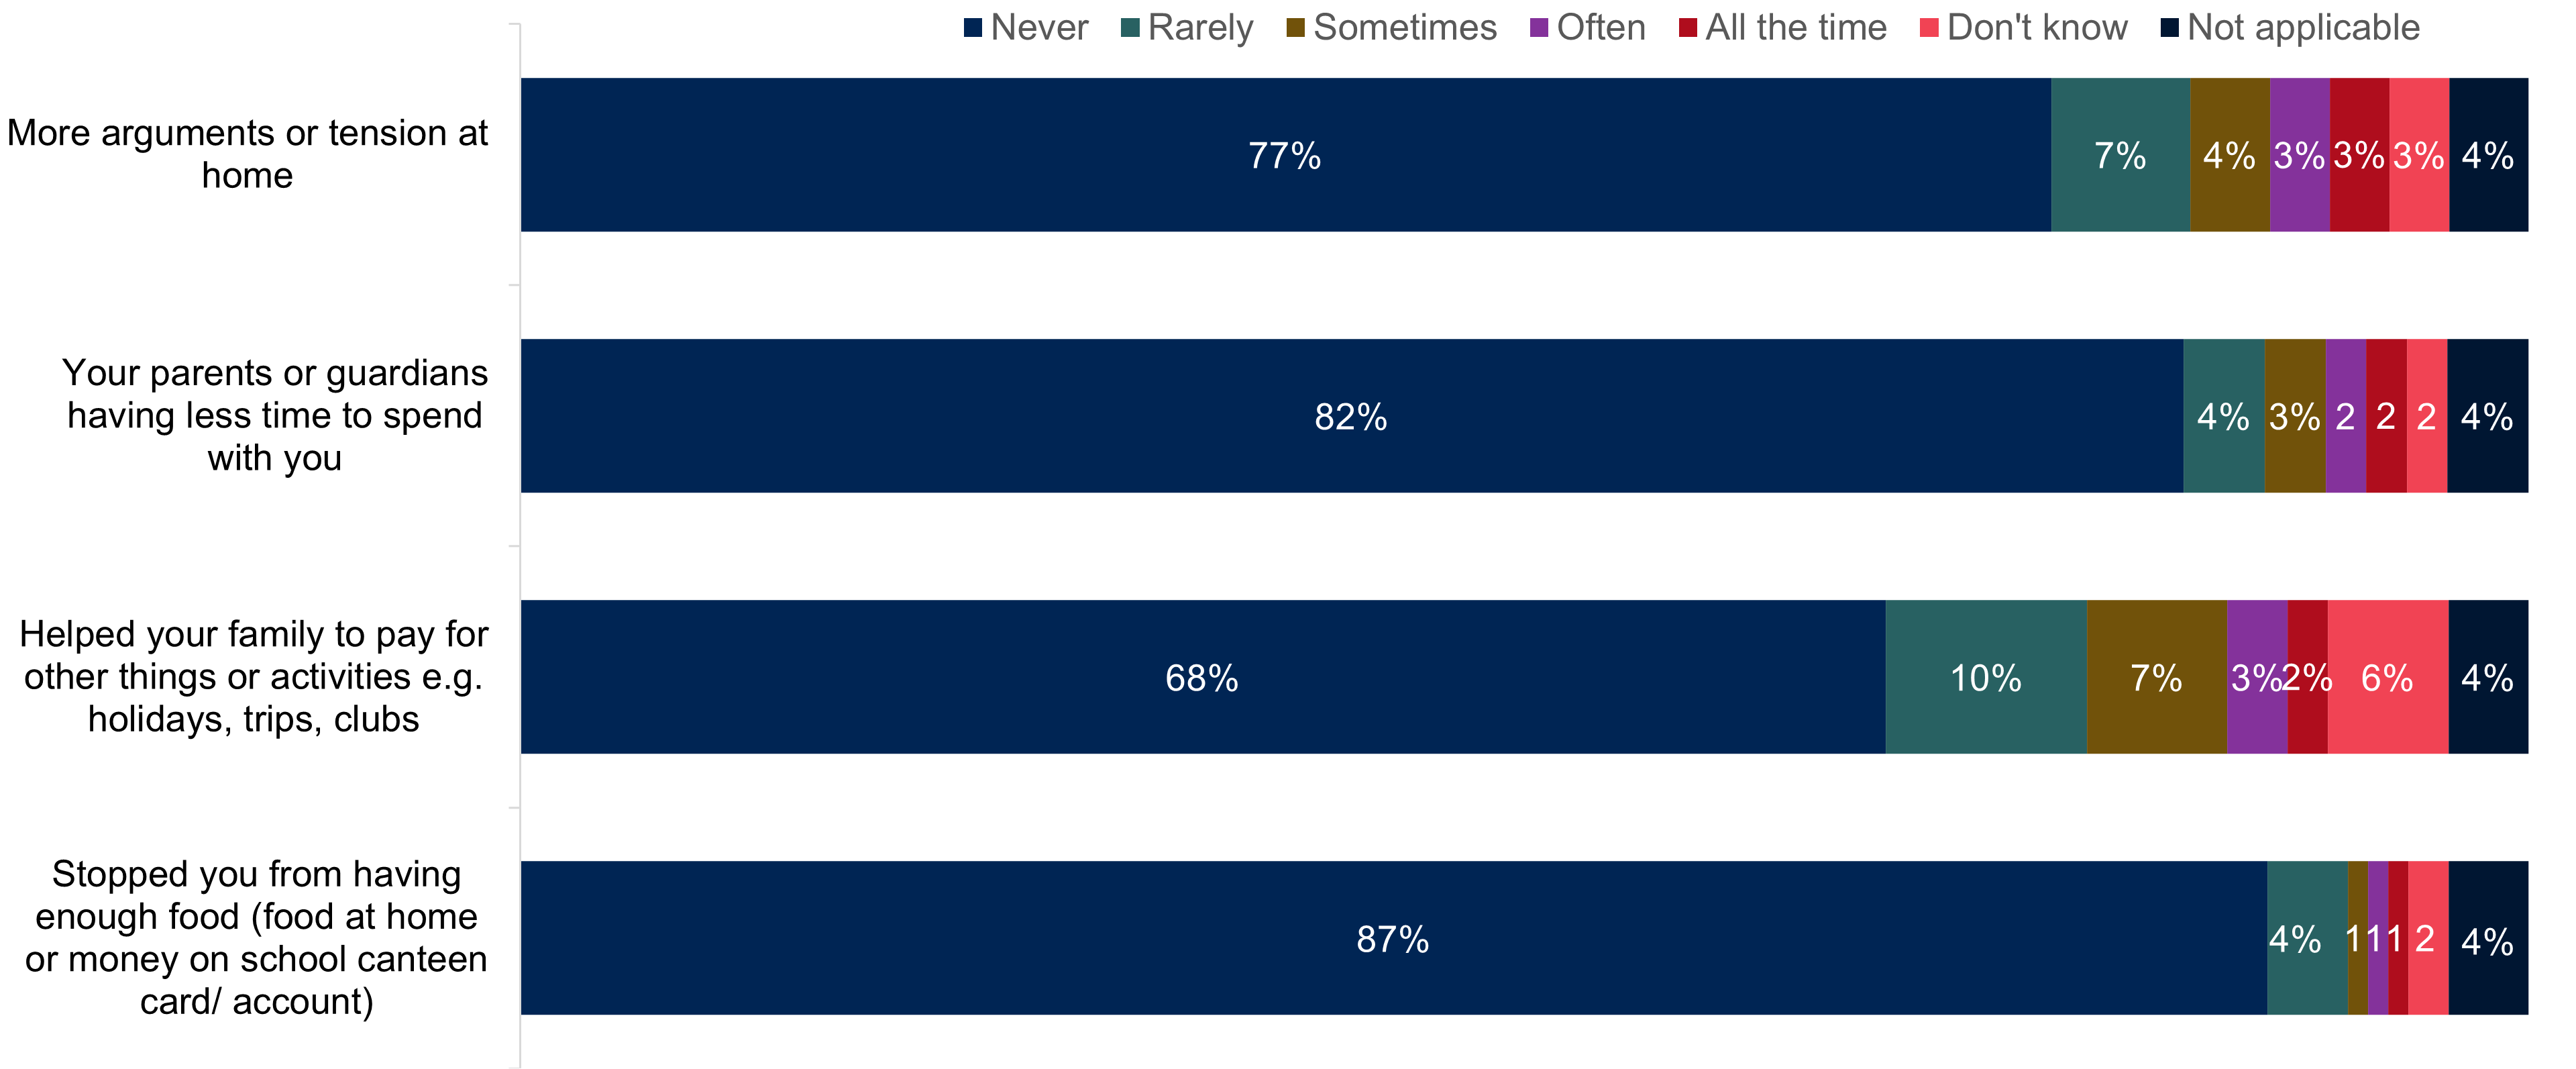
Figure 11 information
GC_FAMGAMFOOD GC_FAMGAMPAY GC_FAMLEDTME GC_FAMLEDARG. Thinking about the last 12 months, how often, if at all, has your family’s gambling led to any of the following things?
Base: All 11 to 17 year olds answering who have seen family members live with gamble 'Stopped you from having enough food (food at home or money on school canteen card or account)' (774). 'Helped your family to pay for other things or activities for example, holidays, trips, clubs' (772). 'Your parents or guardians having less time to spend with you' (774). 'More arguments or tension at home' (773).
| The impact that family members’ gambling can have on young people | Percentage who never | Percentage who rarely | Percentage who sometimes | Percentage who often | Percentage who all the time | Percentage who don't know | Percentage who are not applicable |
|---|---|---|---|---|---|---|---|
| More arguments or tension at home | 77% | 7% | 4% | 3% | 3% | 3% | 4% |
| Your parents or guardians having less time to spend with you | 82% | 4% | 3% | 2% | 2% | 2% | 4% |
| Helped your family pay for other things or activities | 68% | 10% | 7% | 3% | 2% | 6% | 4% |
| Stopped you from having enough food (food at home or money on school canteen card and/or account) | 87% | 4% | 1% | 1% | 1% | 2% | 4% |
Boys were more likely than girls to say that family members gambling had impacted on the availability of food at home or money on school canteen card or account all the time or often (5 percent compared to 1 percent).
Those aged 13 years old who lived with a family member that gambled were more likely than other respondents to say that family members gambling had resulted in more arguments or tension at home (18 percent compared to 9 percent).
Young people who had seen family members they live with gamble were then asked how it had affected them personally. Over one in twenty said that it had made them feel worried (8 percent) or sad (7 percent) either all of the time, some of the time or often. Of these, 2 percent felt worried or sad all of the time about family members or people they live with gambling. However, for the most part they stated that this never happened.
Black and minority ethnic groups were more likely than people from white ethnic groups to say that family members gambling had made them feel worried (15 percent compared to 6 percent).
Figure 12: The impact that family members’ gambling can have on young people’s emotions
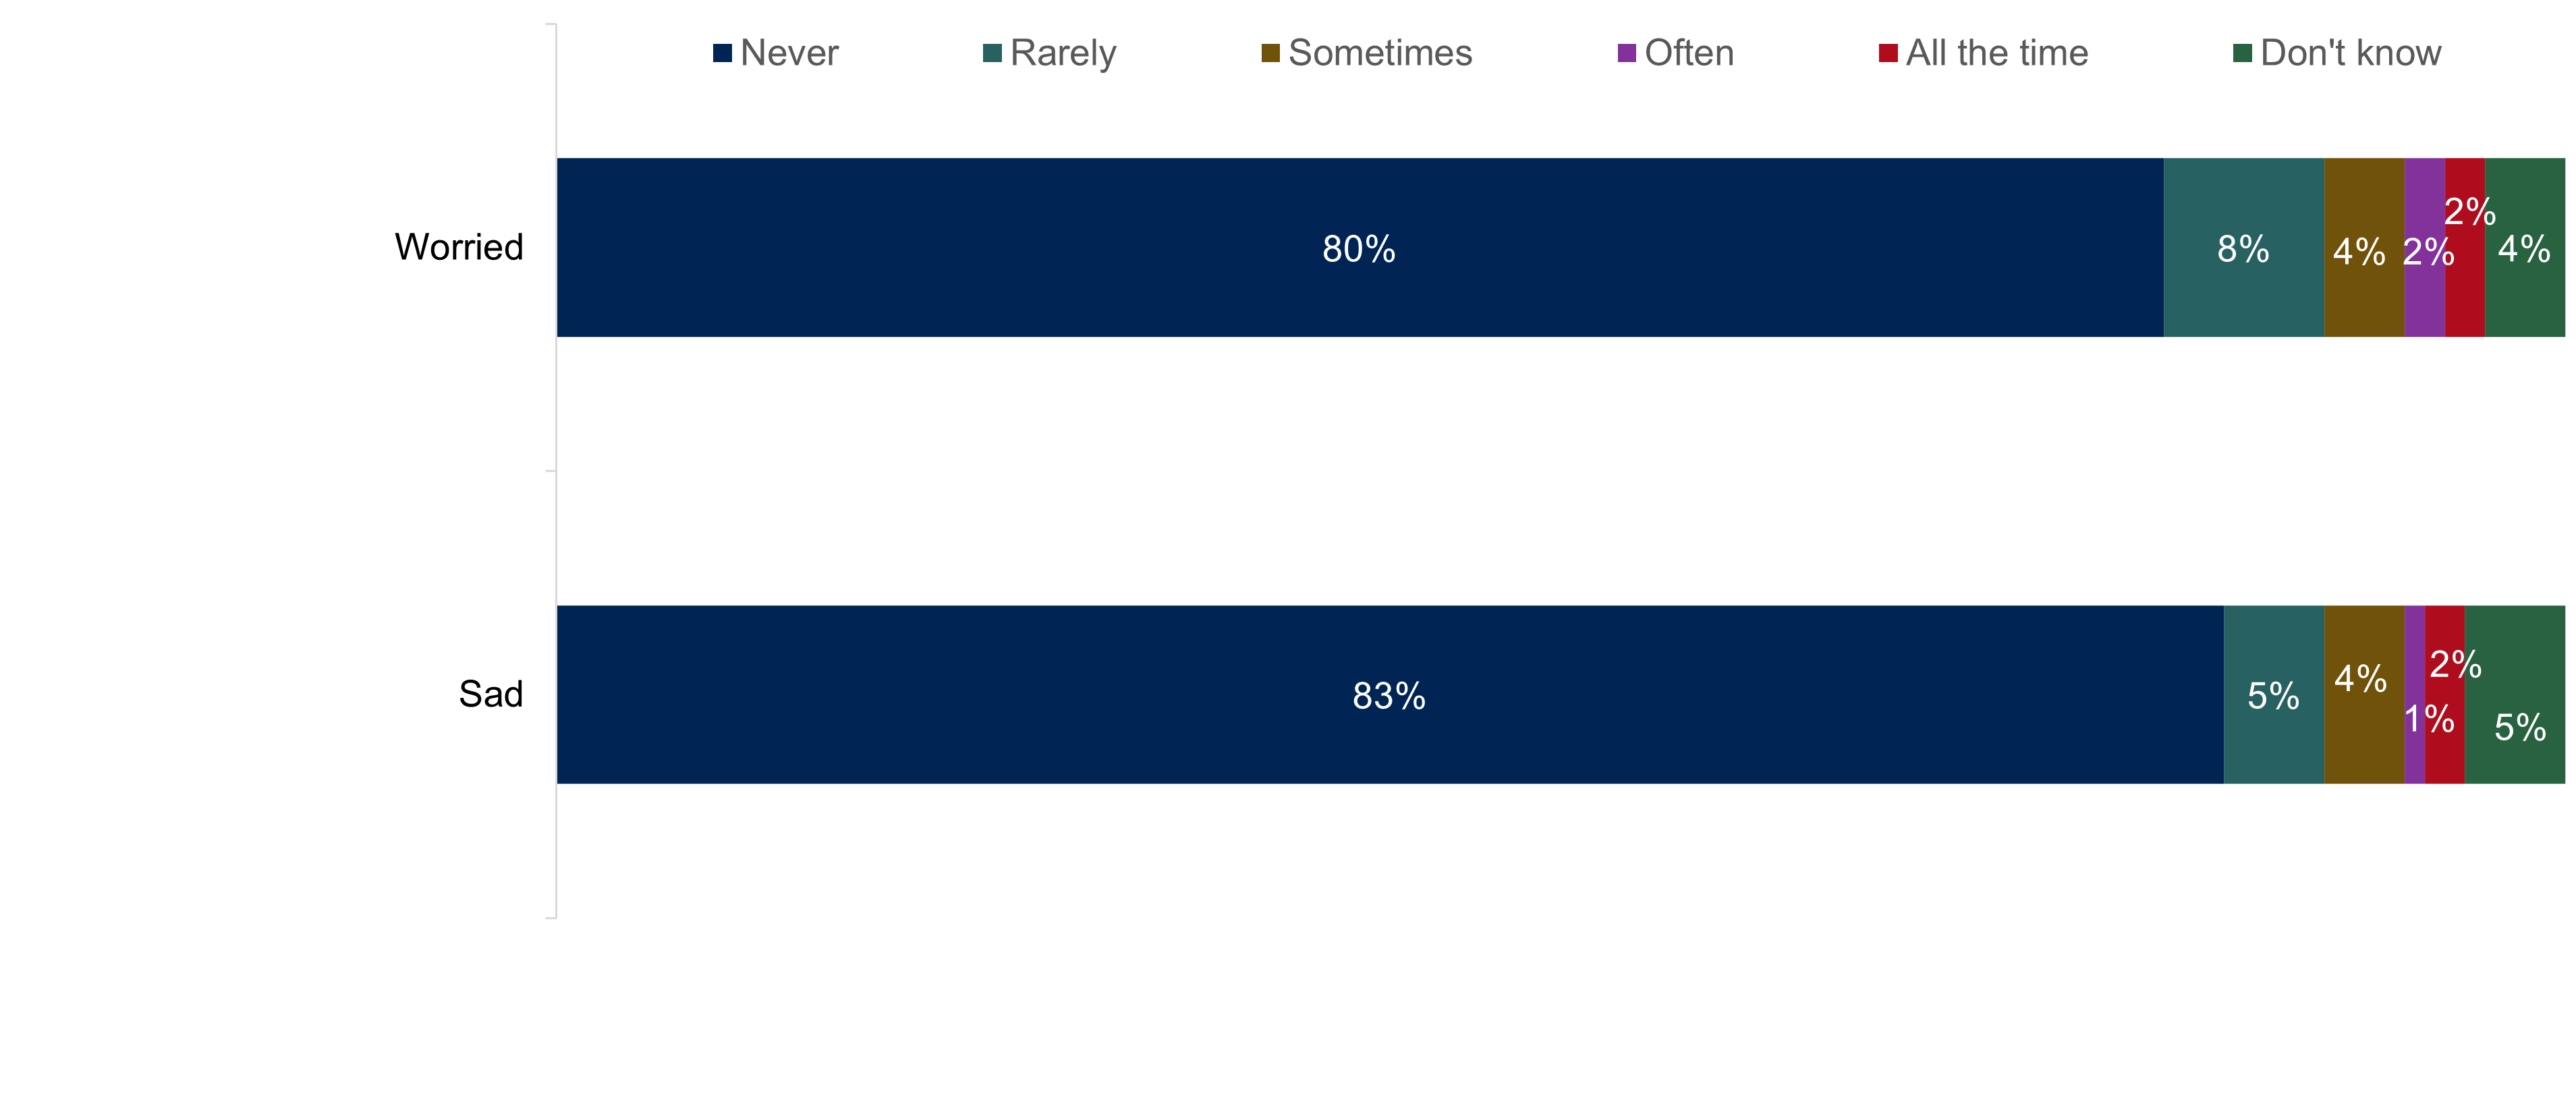
Figure 12 information
GC_NEWFELTBADFAMSAD GC_NEWFELTBADFAMWOR. In the past 12 months how often, if at all, would you say that gambling among your family members and/or people you live with has made you feel…
Base: All 11 to 17 year olds answering who have seen family members live with gamble 'Sad' (754). 'Worried' (751).
| The impact that family members’ gambling can have on young people | Percentage who never | Percentage who rarely | Percentage who sometimes | Percentage who often | Percentage who all the time | Percentage who don't know |
|---|---|---|---|---|---|---|
| Worried | 80% | 8% | 4% | 2% | 2% | 4% |
| Sad | 83% | 5% | 4% | 1% | 2% | 5% |
Online gambling
Summary
This section focuses on online gambling, examining in more detail active involvement and experience over the last 12 months, as well as awareness of eSports and in-game items.
Throughout this section we make comparisons to 2022 data. However, it should be noted that while the 2023 sample included year 12 pupils and independent schools, these were not included in the 2022 sample and therefore any differences between the two years are indicative only.
The proportion of 11 to 17 year olds who were actively involved in online gambling in the last 12 months is low; with the most common activities being betting on eSports, betting on a website or apps, and playing casino games online (1 percent respectively). Less than 1 percent of young people spent their own money on National Lottery online instant win games and online bingo.
Young people were more likely to use their parent's or guardian's accounts for online gambling with their permission (6 percent), rather than without (2 percent) when engaging in online gambling activities.
Overall, 45 percent of young people had heard of in-game items when playing video games and two in five (38 percent) had heard of paying money to open loot boxes. Awareness of, and participation in, paying for in-game items and opening loot boxes was notably higher among boys than girls, reflecting their overall higher levels of involvement in online gambling.
Notably, the closer the use of in-game items gets to gambling the lower the levels of awareness and usage are, with only 2 percent of young people having personally bet with in-game items outside of the game they were playing.
Young people’s active involvement in online gambling
Young people were asked if they had spent their own money on online gambling in the last 12 months. Overall, the proportions are very small with just 1 percent spending their own money on eSports (definition of eSports in Appendix of this report), betting on a website or apps, or casino games online respectively.
The data shows small but significant differences by gender in spend over the last 12 months on online gambling:
- betting on eSports - 1 percent of boys, compared to less than 1 percent of girls
- betting on a website or an app - 1 percent of boys, compared to less than 1 percent of girls
- betting on casino games online – 1 percent of boys, compared to less than 1 percent of girls.
The figures for young people’s active involvement in placing a bet on eSports, betting on a website or apps and playing casino games online are reflective of the trends seen in 2022.
Overall experience of online gambling
A minority of young people have experienced some form of online gambling in the last 12 months. Less than one in twenty 11 to 17 year olds had placed a bet on eSports or on a website or an app in the last 12 months (both 2 percent), with similar findings for those who had played casino games online (1 percent). As few as 1 percent of young people had experienced National Lottery online instant win games or bingo online in the last 12 months.
These figures are reflective of the trends seen in 2022, with a slight decrease in betting on eSports or on a website or an app (1 percentage point decrease respectively) while the proportion of young people who have experienced National Lottery online instant win games remains unchanged in comparison to 2022.
Online gambling using parent's or guardian's accounts
To understand the context in which young people are accessing online gambling, they were asked if they had ever used their parent's or guardian's accounts to play online, with or without their permission.
Overall, young people were more likely to use their parent's or guardian's accounts for any type of online gambling with their permission (6 percent), rather than without (2 percent). When looking at specific gambling accounts, young people were more likely to have played National Lottery games online with their parent's or guardian's permission (5 percent), than without (2 percent). Similarly, young people were more likely to have played on gambling websites or placed bets online with their parent's or guardian's permission (5 percent) compared with those without (2 percent).
These figures are reflective of the trends seen in 2022.
Figure 13: Online gambling using a parent's or guardian’s account - Whether young people gambled online with their parent's or guardian's permission or not

Figure 13 information
PLAYONLINE. Please read all of the following sentences and select those that are true about you. Here ‘online’ refers to websites and apps.
Base: All 11 to 17 year olds answering (2,750).
Note: This is a multiple response question, so the responses shown will not add up to 100 percent.
| Online gambling behaviour | Percentage who find this sentence true (multiple response question, therefore answers do not sum to 100 percent) |
|---|---|
| Used parent's and/or guardian's account to play National Lottery games online with their permission | 5% |
| Used parent's and/or guardian's account to play on gambling websites or place bets online with their permission | 5% |
| Used parent's and/or guardian's account to play National Lottery games online without their permission | 2% |
| Used parent's and/or guardian's account to play on gambling websites or place bets online without their permission | 2% |
| None of these sentences are true about me | 92% |
Awareness and use of in-game items in video games
Skins are one example of in-game items which can be won or bought within a video game to change the appearance of a character, avatar or weapon. On some websites (separate to the game itself), players can trade, bet on and sell their skins in exchange for cash. This is called skins gambling.
One commonly used method for players to acquire in-game items is through in-game payments to open loot boxes which contain an unknown quantity and value of in-game items. The use of features which include expenditure and chance has led to concern that loot boxes are akin to gambling. The Gambling Commission’s view on skins gambling, loot boxes and related issues is as set out in the position paper entitled 'Virtual currencies, eSports and social casino gaming – position paper' published in March 2017 (opens in new tab) (PDF).
Just over one third (34 percent) had paid for in-game items or ‘mods’ (for example, skins, clothes, weapons, players) either with their own money or virtual currency, and 21 percent had spent money or virtual currency to unlock loot boxes, packs or chests to acquire in-game items (for example, skins, clothes, weapons, players).
As shown in Figure 14, the closer that the use of in-game items gets to gambling (for example betting with in-game items, money or virtual currency in hopes of winning a prize) the lower the levels of awareness and usage are, with only 2 percent of young people having personally bet with in-game items.
The amount of young people who are aware of and have used in-game items has decreased by 5 percentage points in comparison to 2022 (43 percent). Similarly, those who paid for in-game items or mods with either money or virtual currency, and those who paid to open loot boxes, packs or chests to get in-game items has seen a decrease of 5 percentage points and 3 percentage points respectively (39 percent and 24 percent in 2022).
Figure 14: Awareness and use of in-game items
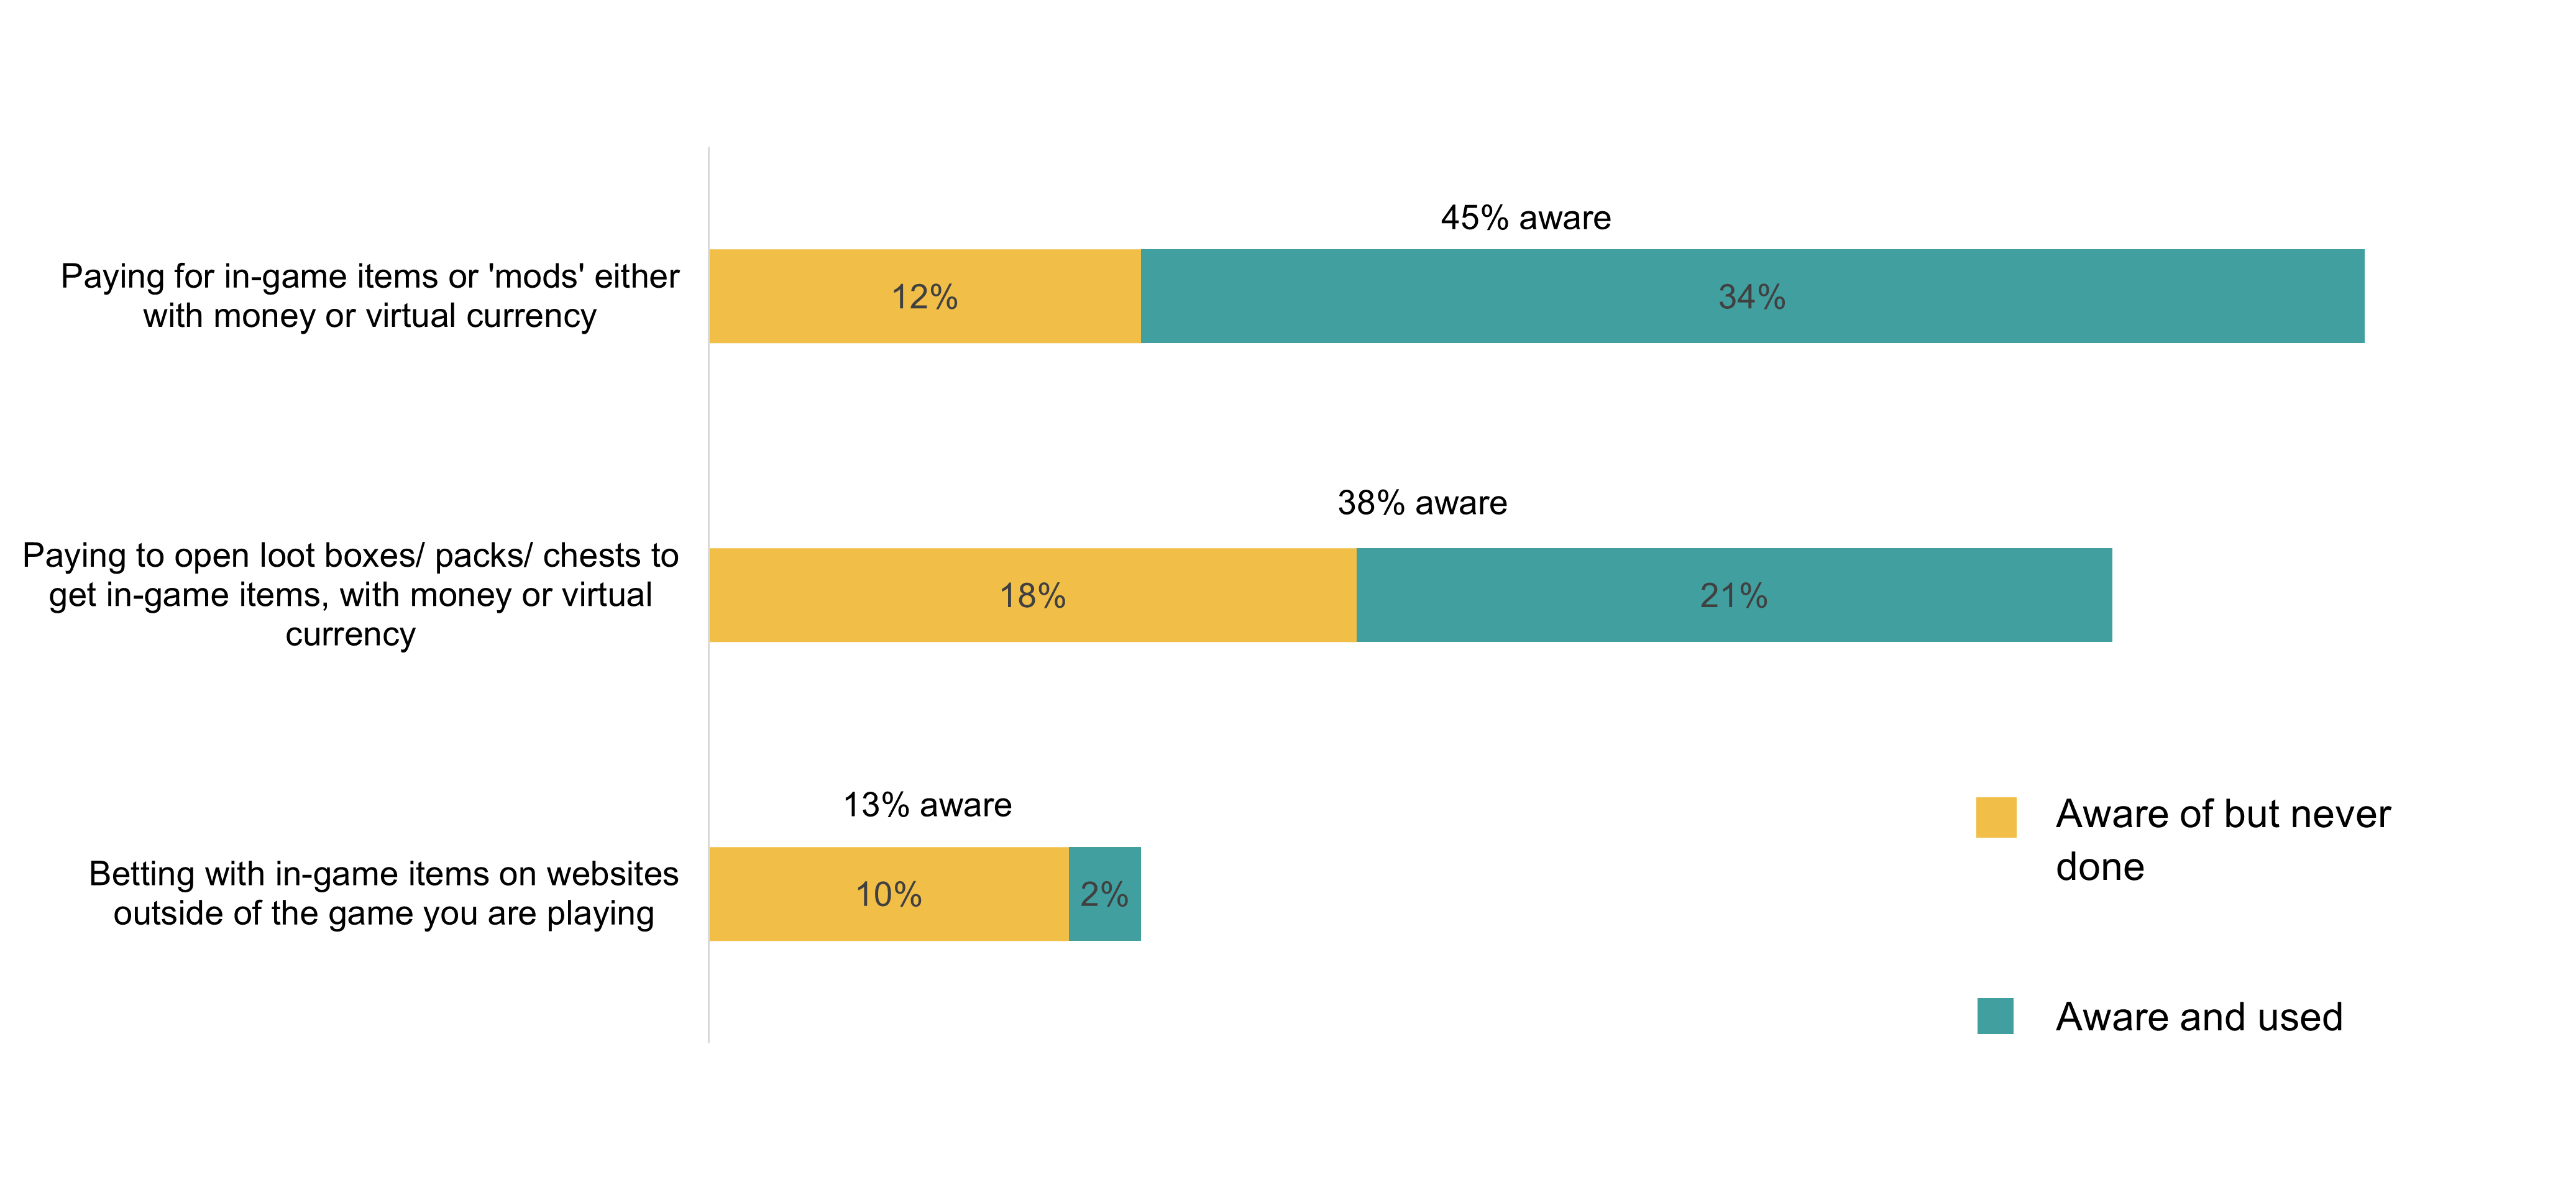
Figure 14 information
INGAMEAWARE. The following list shows some different things that it is possible to do with in-game items. Which, if any, of these have you heard about before today?
Base: All 11 to 17 year olds answering (2,749).
INGAMEUSED. Which, if any, of the following have you personally done?
Base: All 11 to 17 year olds answering who were aware of in-game items (1,649).
Note: This shows responses to two separate questions, with exclusions of Don’t know and Not stated response, so the total will not add up to 100 percent.
Note: The data included in the third column ('Not aware of in-game items') was calculated based on the percentages of other answer choices.
| Awareness and use of in-game items | Percentage who are aware of in-game items, but never done them (answers do not sum to 100 percent) | Percentage who are not aware of in-game items, but never done them (answers do not sum to 100 percent) | Percentage who are aware of and used in-game items (answers do not sum to 100 percent) |
|---|---|---|---|
| Paying for in-game items or mods (for example skins, clothes, weapons, players) either with money or virtual currency | 45% | 12% | 34% |
| Paying to open loot boxes and/or packs and/or chests to get in-game items (for example skins, clothes, weapons, players) either with money or virtual currency | 38% | 18% | 21% |
| Betting with in-game items on websites outside of the game you are playing | 13% | 10% | 2% |
Boys were more likely to be aware of and have used in-game items than girls (50 percent compared to 25 percent), reflecting the fact that they are more likely to play video games and gamble online:
- boys were more likely to purchase in-game items with real money or virtual currency than girls, (45 percent, compared with 22 percent)
- boys were also more likely to pay for opening loot boxes, packs or chests to get in-game items than girls, (31 percent, compared with 10 percent)
- boys were also more likely to bet with in-game items on websites outside of the game they were playing than girls, (4 percent, compared with 1 percent).
Awareness and use of virtual money or tokens to bet on sports matches
Figure 15: Whether young people have ever used apps or websites which allow them to use virtual money or tokens to bet on sports matches
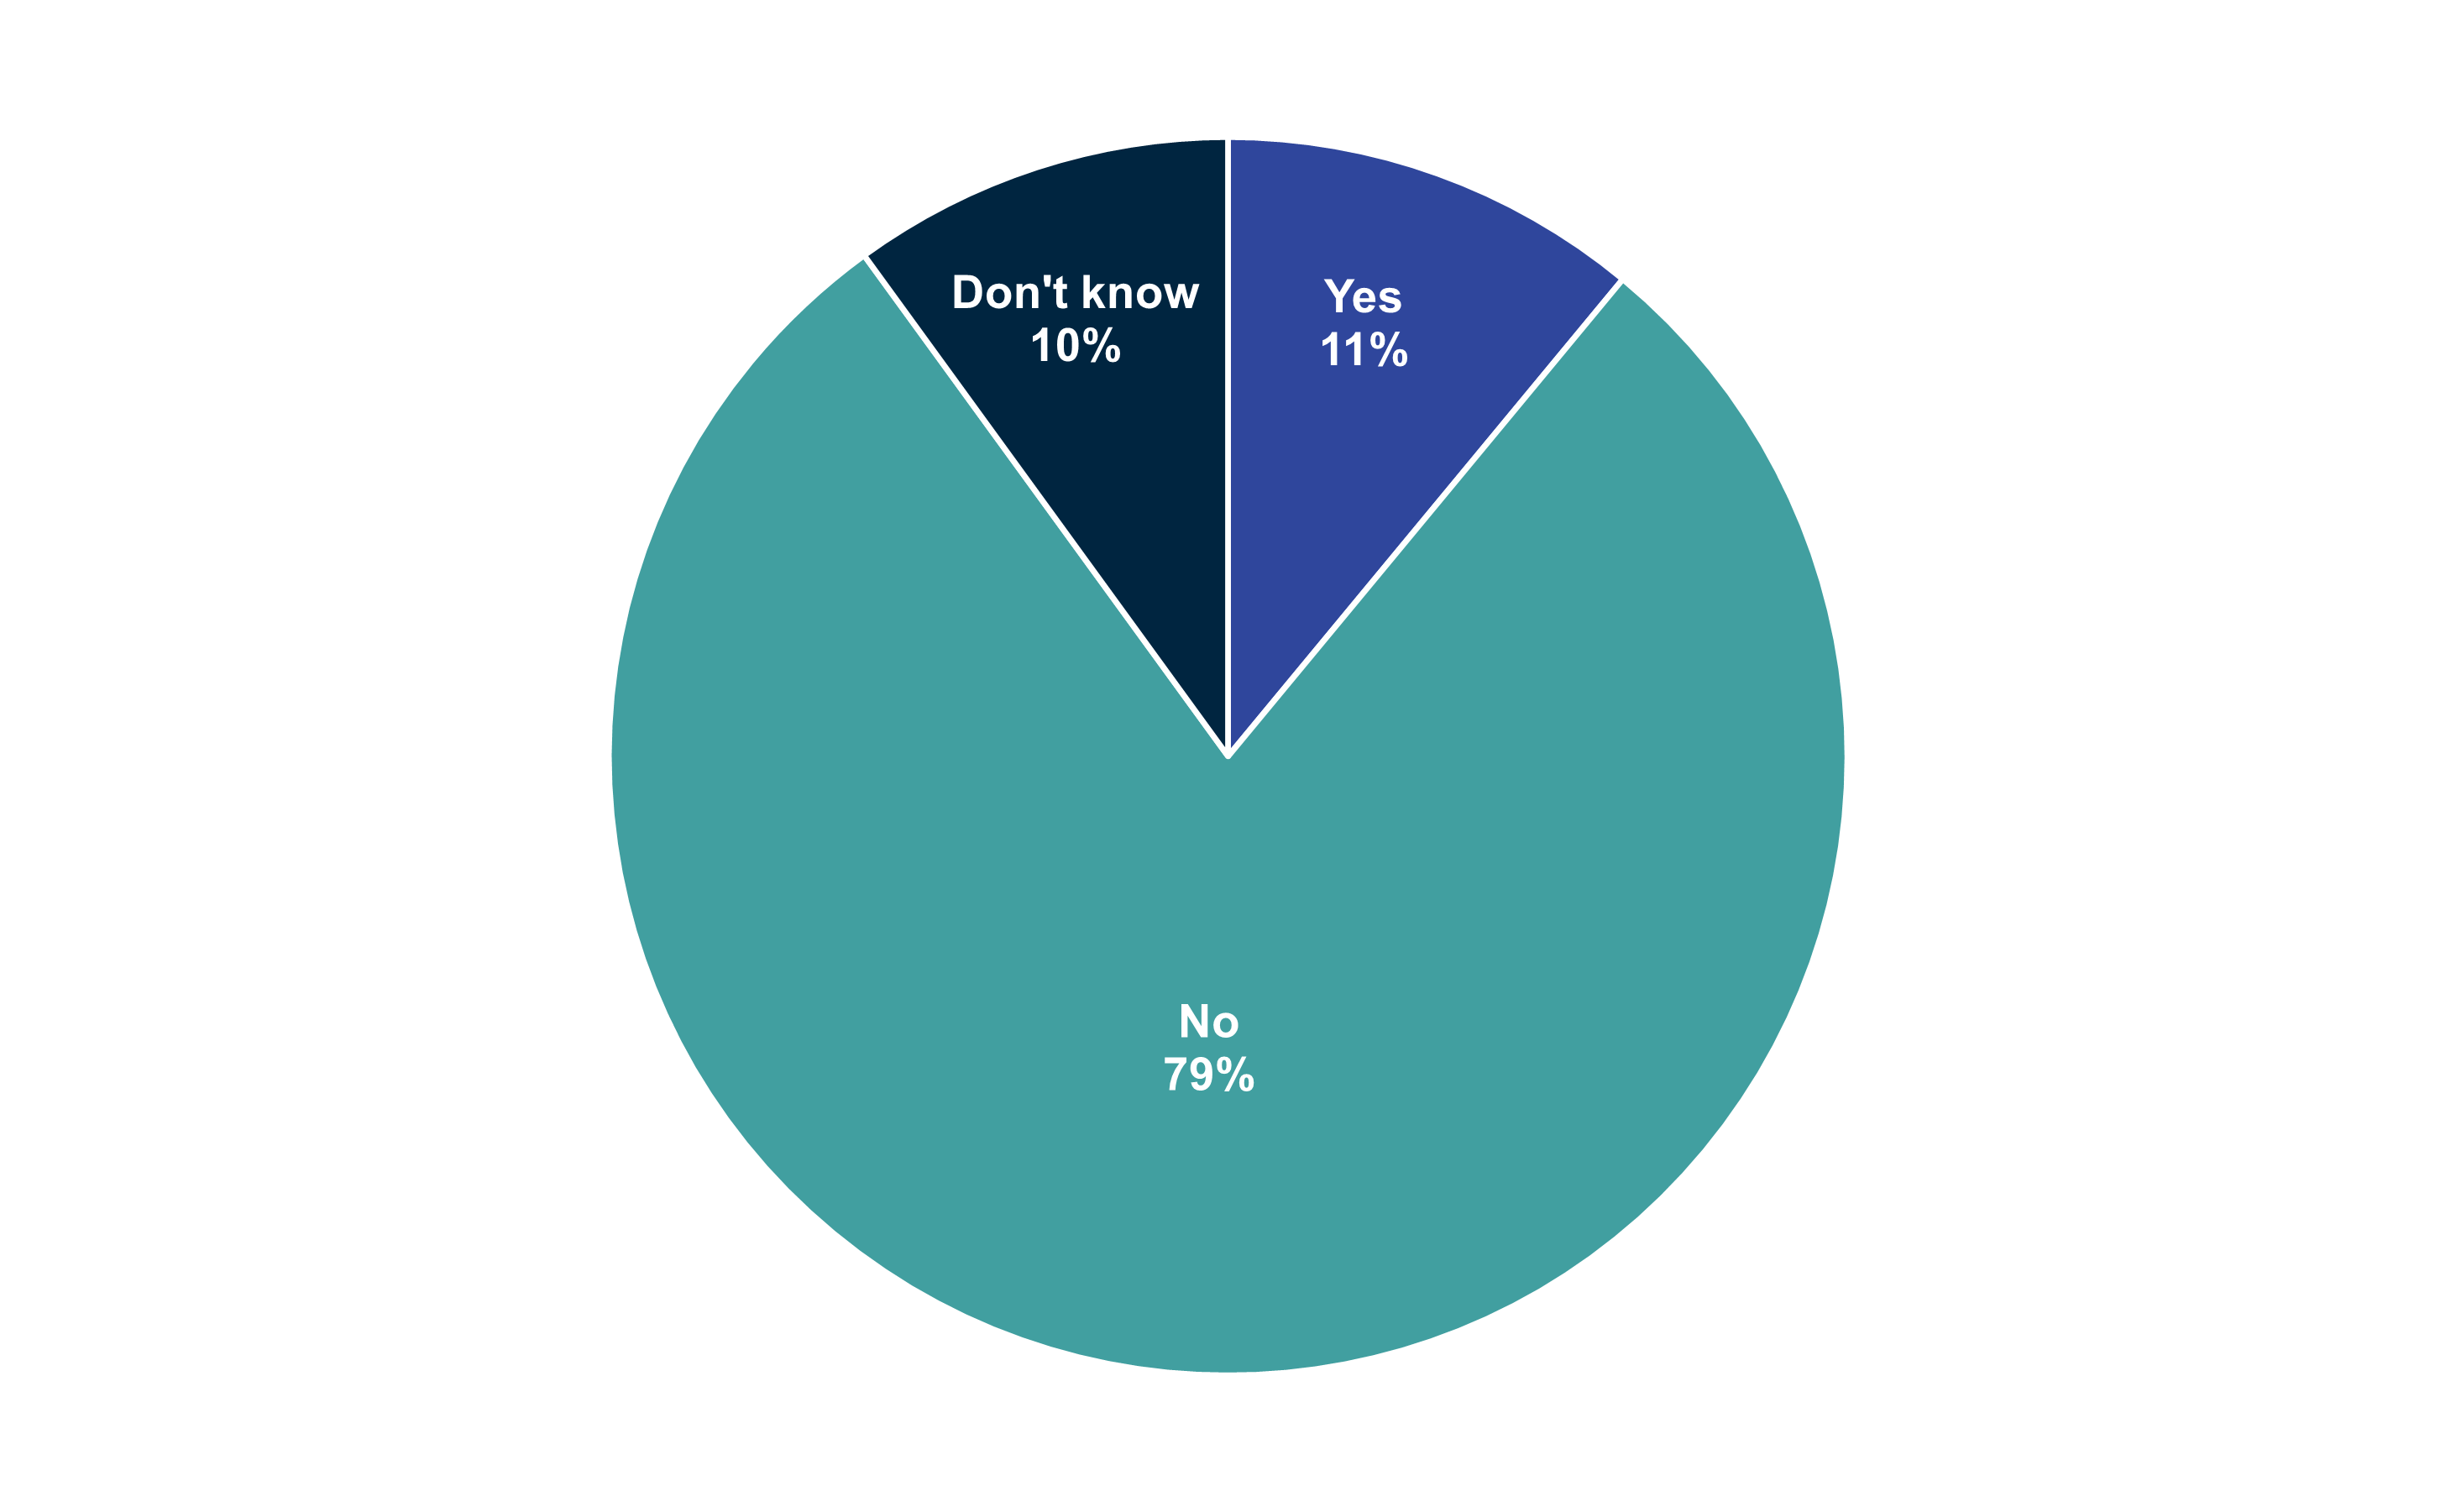
Figure 15 information
GC_SPORTSBET. Have you ever used apps or websites which allow you to use virtual money or tokens to bet on sports matches?
Base: All participants answering (2,852).
| Experience using apps to use virtual money or tokens to bet on sports matches | Percentage |
|---|---|
| Yes | 11% |
| No | 79% |
| Don't know | 10% |
To further explore the way in which young people engage online, they were asked if they had ever used apps or websites which allow them to use virtual money or tokens to bet on sports matches. One in ten (11 percent) of young people have experienced using virtual money in apps and on websites to bet on sports matches.
Boys were more likely (14 percent) to have had experience with these apps and websites than girls (7 percent). Additionally, respondents being identified as ‘at risk’ on the youth adapted problem gambling screen Diagnostic and Statistical Manual of Mental Disorders 4th Edition - Multiple Response Juvenile (DSM-IV-MR-J) were more likely (26 percent) to have had experience with these apps and websites than those identified as ‘non-gamblers’ (9 percent).
National Lottery play
Summary
This section focuses on lottery play, examining in more detail active involvement and experience with National Lottery products and looking at who young people are with when they play.
Overall, 7 percent of 11 to 17 year olds have played a National Lottery game in the last 12 months. However, only 1 percent of young people were actively involved having spent their own money on a lottery game during that period, with just 1 percent spending their own money on a National Lottery draw or buying a National Lottery scratchcard or taking part in National Lottery instant win games.
It’s important to note that most young people were in the company of their parents, carers or guardians when purchasing a National Lottery product and in most cases, they did not make the purchase themselves.
This section covers participation in National Lottery games over the last 12 months. Please note that legislation changed in 2021 to increase the age people can play National Lottery games from 16 to 18 years old. For more information, read The National Lottery Service Guide (opens in new tab).
Young people’s active involvement with lottery products
Overall, 1 percent of all young people spent their own money on a lottery product in the last 12 months: 1 percent had spent their own money on either a National Lottery scratchcard, a National Lottery draw based game or National Lottery online instant win game.
Wider experience of lottery games
Looking at experience over the last 12 months, just under one in ten 11 to 17 year olds (7 percent) have played a lottery game; typically, National Lottery scratchcards (6 percent). Just 2 percent had experience of National Lottery draws games and only 1 percent had played National Lottery online instant win games in the same time period. In this context, ‘experience’ could mean getting involved with picking lottery numbers or scratching off the numbers on someone else’s ticket or card, as discussed in the next section.
Buying a National Lottery draw ticket or scratchcard
To set these findings in context, young people who have ever experienced play on a National Lottery draw based game or scratchcard, were asked how the purchase was made. It’s important to note that the number of young people who self-reported experience of National Lottery draw based games is small (base size of 116), so the figures should be interpreted with caution. However, the data indicates that for both draw based and scratchcard games, in the vast majority of cases someone else made the purchase for young people.
Almost all (96 percent) young people who had played National Lottery scratchcards said that someone else purchased the scratchcard for them.
In 2023 only 3 percent said that they purchased the scratchcard themselves. Similarly, 83 percent of young people who bought a ticket for a National Lottery draw based game said that someone else made the purchase for them.
However, 8 percent said that they had made the purchase themselves suggesting that a significant minority of young people were allowed to buy a ticket underage.
Figure 16: How National Lottery draw games and scratchcards were purchased
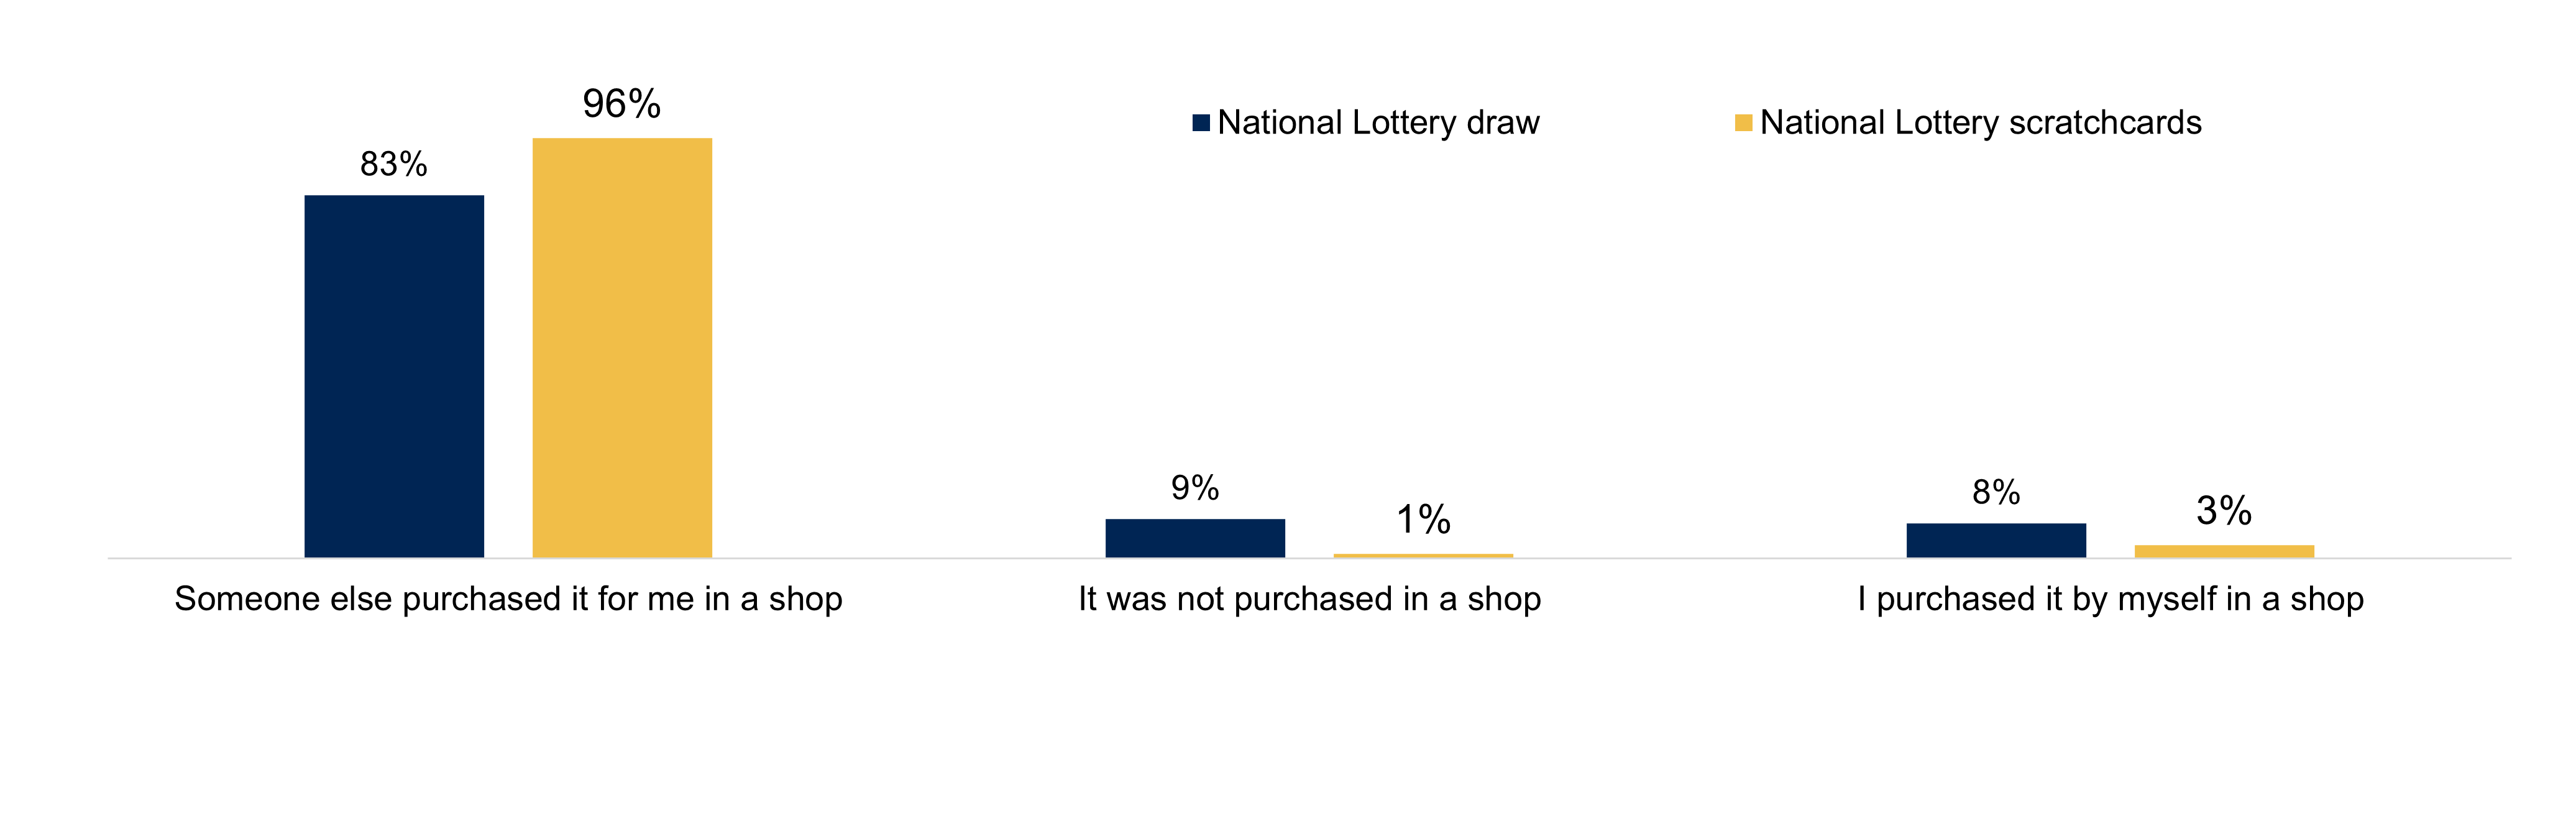
Figure 16 information
GC_HANDED1. Thinking about the last time you played National Lottery draw or scratchcard which statement best describes how you purchased and paid for the item?
Base: All 11 to 17 year olds answering who have played National Lottery (116). All participants answering who have played National Lottery scratchcards (260).
How National Lottery draw games were purchased
| How National Lottery draw game tickets were purchased | Percentage |
|---|---|
| Someone else purchased the ticket for me in a shop | 83% |
| The ticket was not purchased in a shop | 9% |
| I purchased the ticket by myself in a shop | 8% |
How National Lottery scratchcards were purchased
| How National Lottery scratchcards were purchased | Percentage |
|---|---|
| Someone else purchased the scratchcard for me in a shop | 96% |
| The scratchcard was not purchased in a shop | 1% |
| I purchased the scratchcard by myself in a shop | 3% |
Who young people are with when playing a National Lottery product
Most young people who participated in the National Lottery were in the company of a parent, carer or guardian. For example, when playing National Lottery scratchcards, the majority (77 percent) of young people were with a parent, carer or guardian.
Only a minority (4 percent) of 11 to 17 year olds were alone when playing National Lottery scratchcards.
When playing a National Lottery draw based game, the majority (69 percent) of young people were also with their parents or guardians during the activity. Just under one in ten (8 percent) were alone when taking part in a National Lottery draw based game and boys were more likely than girls to be alone when playing this type of game, while girls were more likely than boys to be with their parents or guardians during the activity.
The proportion of young people playing National Lottery instant win games is too small to allow robust analysis (base of 55), but the findings indicate that most were with someone at the time.
Figure 17: Who young people were with when playing National Lottery games
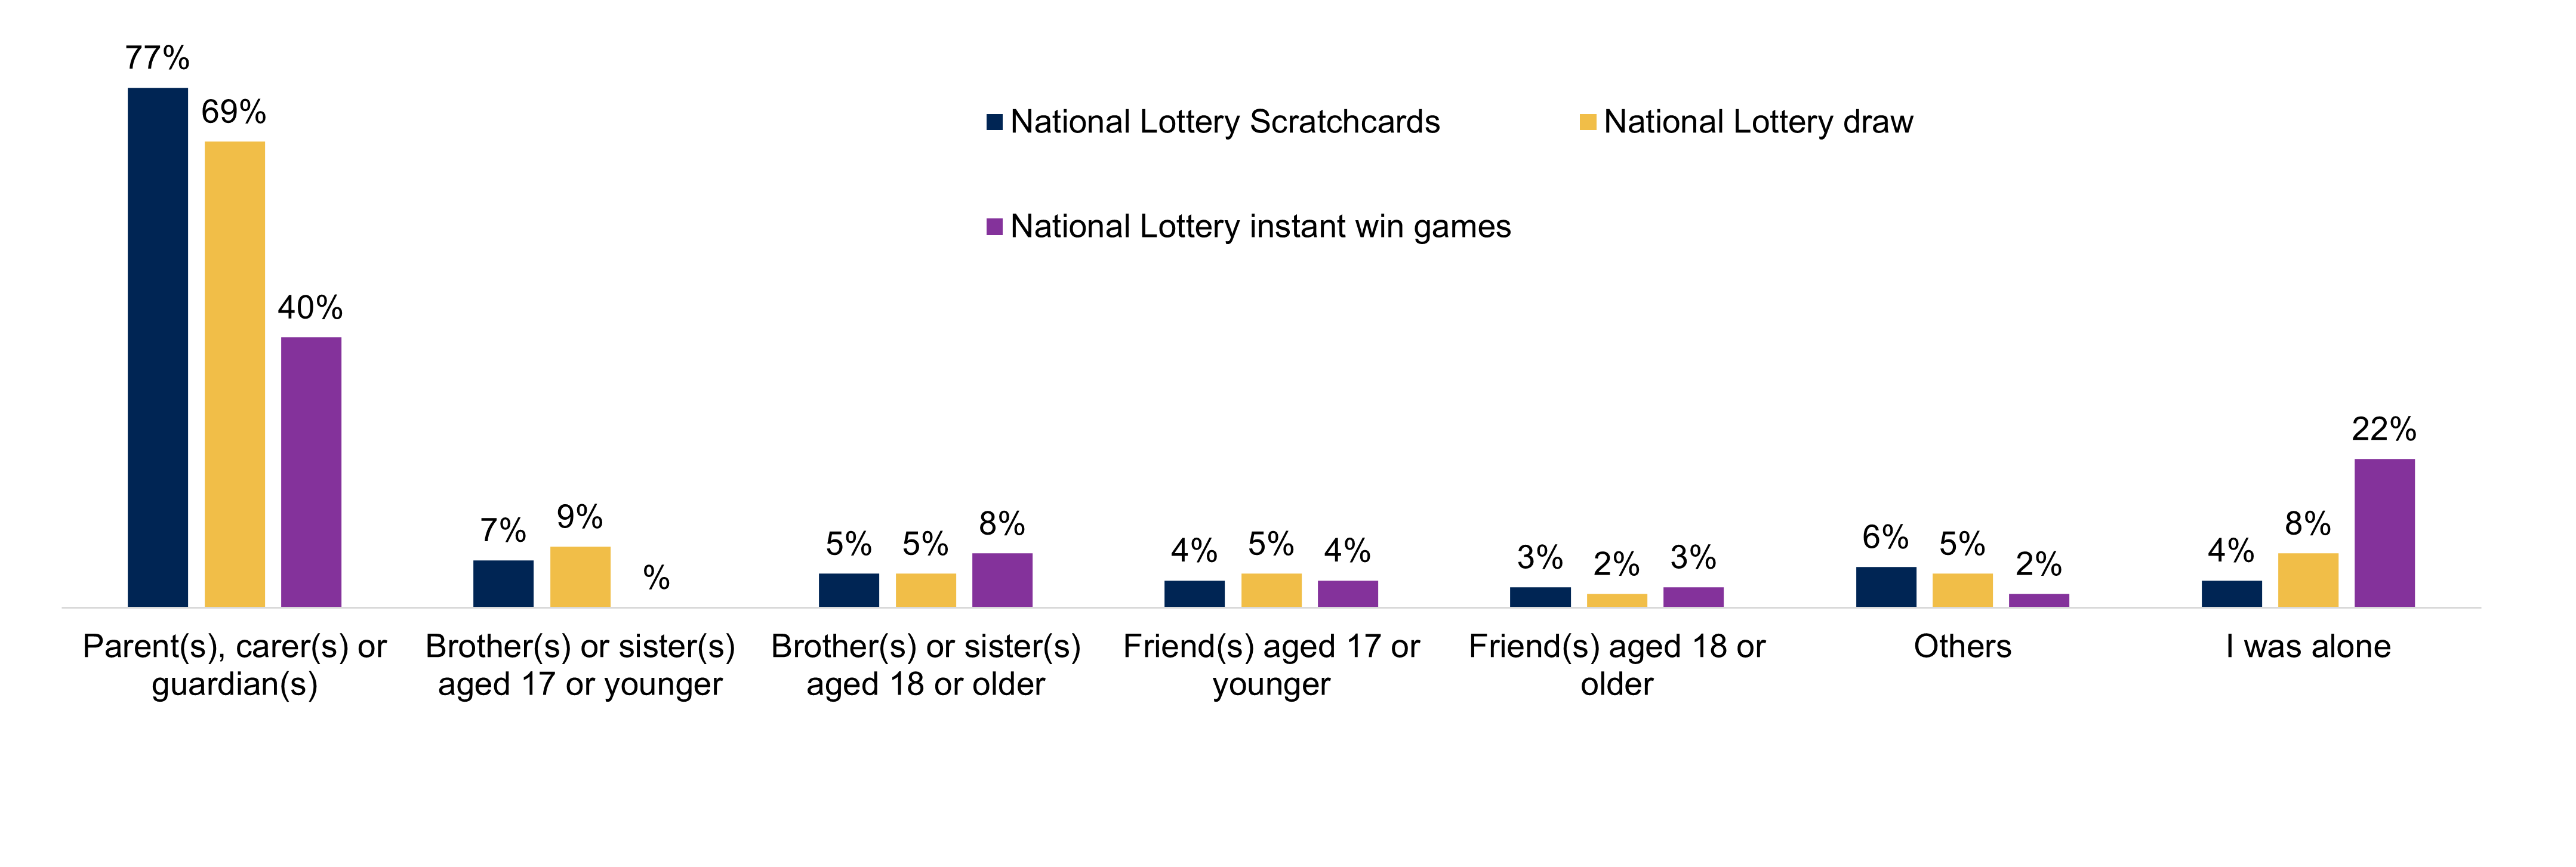
Figure 17 information
GC_GAMSPEND2. Last time you did [this activity / these activities] who were you with?
Base: All 11 to 17 year olds answering who have played National Lottery scratchcards (342), National Lottery draw (159), National Lottery online instant win games (55).
Note: This chart shows responses to three separate questions, so the total will not add up to 100 percent
| Who young people were with when participating in National Lottery products | National Lottery scratchcards participation percentage (multiple response question, therefore answers do not sum to 100 percent) | National Lottery draws participation percentage (multiple response question, therefore answers do not sum to 100 percent) | National Lottery instant win games participation percentage (multiple response question, therefore answers do not sum to 100 percent) |
|---|---|---|---|
| Parent(s), carer(s) or guardian(s) | 77% | 69% | 40% |
| Brother(s) and/or sister(s) aged 17 or younger | 7% | 9% | 0% |
| Brother(s) and/or sister(s) aged 18 or older | 5% | 5% | 8% |
| Friend(s) aged 17 years or younger | 4% | 5% | 4% |
| Friend(s) aged 18 years or older | 3% | 2% | 3% |
| Others | 6% | 5% | 2% |
| I was alone | 4% | 8% | 22% |
Games and gaming machines
Summary
This section reviews active involvement in and experience with games and gaming machines in the last 12 months. Highlighting who young people are with, the most popular forms of gaming machine and experience of play in adults-only areas of venues such as holiday parks and arcades.
Throughout this section we make comparisons to 2022 data. However, it should be noted that while the 2023 sample included year 12 pupils and independent schools, these were not included in the 2022 sample and therefore any differences between the two years are indicative only.
Arcade gaming machines, such as penny pushers or claw grab machines, continue to be the most common type of gambling activity for young people. One in five (19 percent) 11 to 17 year olds spent their own money on playing arcade gaming machines in the last 12 months. A further 3 percent had spent their own money on playing fruit or slot machines, at an arcade, pub, or social club, over the same period.
To put this in context, four in ten (40 percent) 11 to 17 year olds have experienced gambling activities in the last 12 months, with three in ten (30 percent) playing on arcade gaming machines.
Young people were typically with someone when they played on arcade gaming machines (90 percent) or fruit and slot machines (82 percent), and most (79 percent) had no experience of playing on arcade gaming machines in an adults-only area in an amusement arcade or holiday park, or somewhere with a sign or sticker saying 18 years old or over.
Young people’s active involvement in games and gaming machines
One in five (19 percent) young people had spent their own money on playing arcade gaming machines such as penny pushers or claw grab machines in the last 12 months, the most popular gambling activity to be involved in. This is more prevalent amongst young people from white ethnic groups (21 percent) than young people from black or other ethnic backgrounds (13 percent).
In the same time period, 3 percent of young people had spent their own money on playing fruit or slot machines and less than 1 percent had spent their own money playing gambling machines in a betting shop.
While there has been a 3 percentage point decrease in the amount of young people spending their own money on playing arcade games such as penny pushers or claw grab games in comparison to 2022, it remains the most popular gambling activity for young people to be involved in. There has also been a decrease in prevalence of young people from white ethnic groups spending money on arcade gaming machines in comparison to 2022 (25 percent), they still however remain more likely than respondents from black and other ethnic groups to engage in this activity.
The amount of young people who had spent their own money on playing fruit or slot machines and had spent their own money playing gambling machines in a betting shop remains unchanged in comparison to 2022 (3 percent and less than 1 percent respectively).
Overall experience of games and gaming machines play
Three in ten (30 percent) young people had experienced play on arcade gaming machines, in the last 12 months. This proportion was highest amongst those aged 11 to 13 years old (33 percent), while it was 28 percent for those aged 14 to 16 years old and lowest for those aged 17 years old (25 percent). Differences were also evident across ethnicity with young people from white ethnic groups more likely to have played arcade games in the last 12 months, than young people from ethnic minority backgrounds (32 percent, compared to 24 percent).
Experience of playing on fruit or slot machines was lower. Just 6 percent of young people did so in the last 12 months.
There has been a 5 percentage point decrease in the proportion of young people who had experienced play on arcade gaming machines since 2022 (35 percent in 2022). While young people of white ethnic groups remain more likely to have played arcade games in the last 12 months than other ethnic groups, there has been a decrease in this figure (38 percent in 2022).
There has been no change in the experience of playing on fruit and slot machines in comparison to 2022. Again, it should be noted that the 2022 sample did not include year 12 pupils or independent schools, so any differences are indicative only.
Who is with young people when they play gaming machines
The majority of young people have someone else present when they play arcade gaming machines (90 percent) or fruit and slot machines (82 percent). In both instances, for around half of young people this is typically a parent or guardian (55 percent for arcade gaming machines and 53 percent for fruit and slot machines).
While parents or guardians are most likely to be accompanying the young person playing an arcade gaming machine, this is more prevalent amongst those aged 11 to 13 years old (63 percent) than those aged 14 to 16 years old (50 percent) or those aged 17 years old (36 percent).
Compared to those aged 11 to 13 years old, young people aged 14 to 16 years old are more likely to be accompanied by friends who were aged 17 years old and younger (38 percent, compared with 26 percent).
When playing arcade gaming machines, only a minority (4 percent) were alone when playing. Boys were more likely to be alone than girls (6 percent, compared with 1 percent).
Parents and guardians are most likely to be present with young people who have someone with them when playing arcade gaming machines and fruit and slot machines, however this has seen a slight decrease in comparison to 2022 (2 percentage point decrease from 57 percent for arcade gaming machines and 7 percentage point decrease for fruit and slot machines).
Figure 18: Who young people were with when playing games and gaming machines
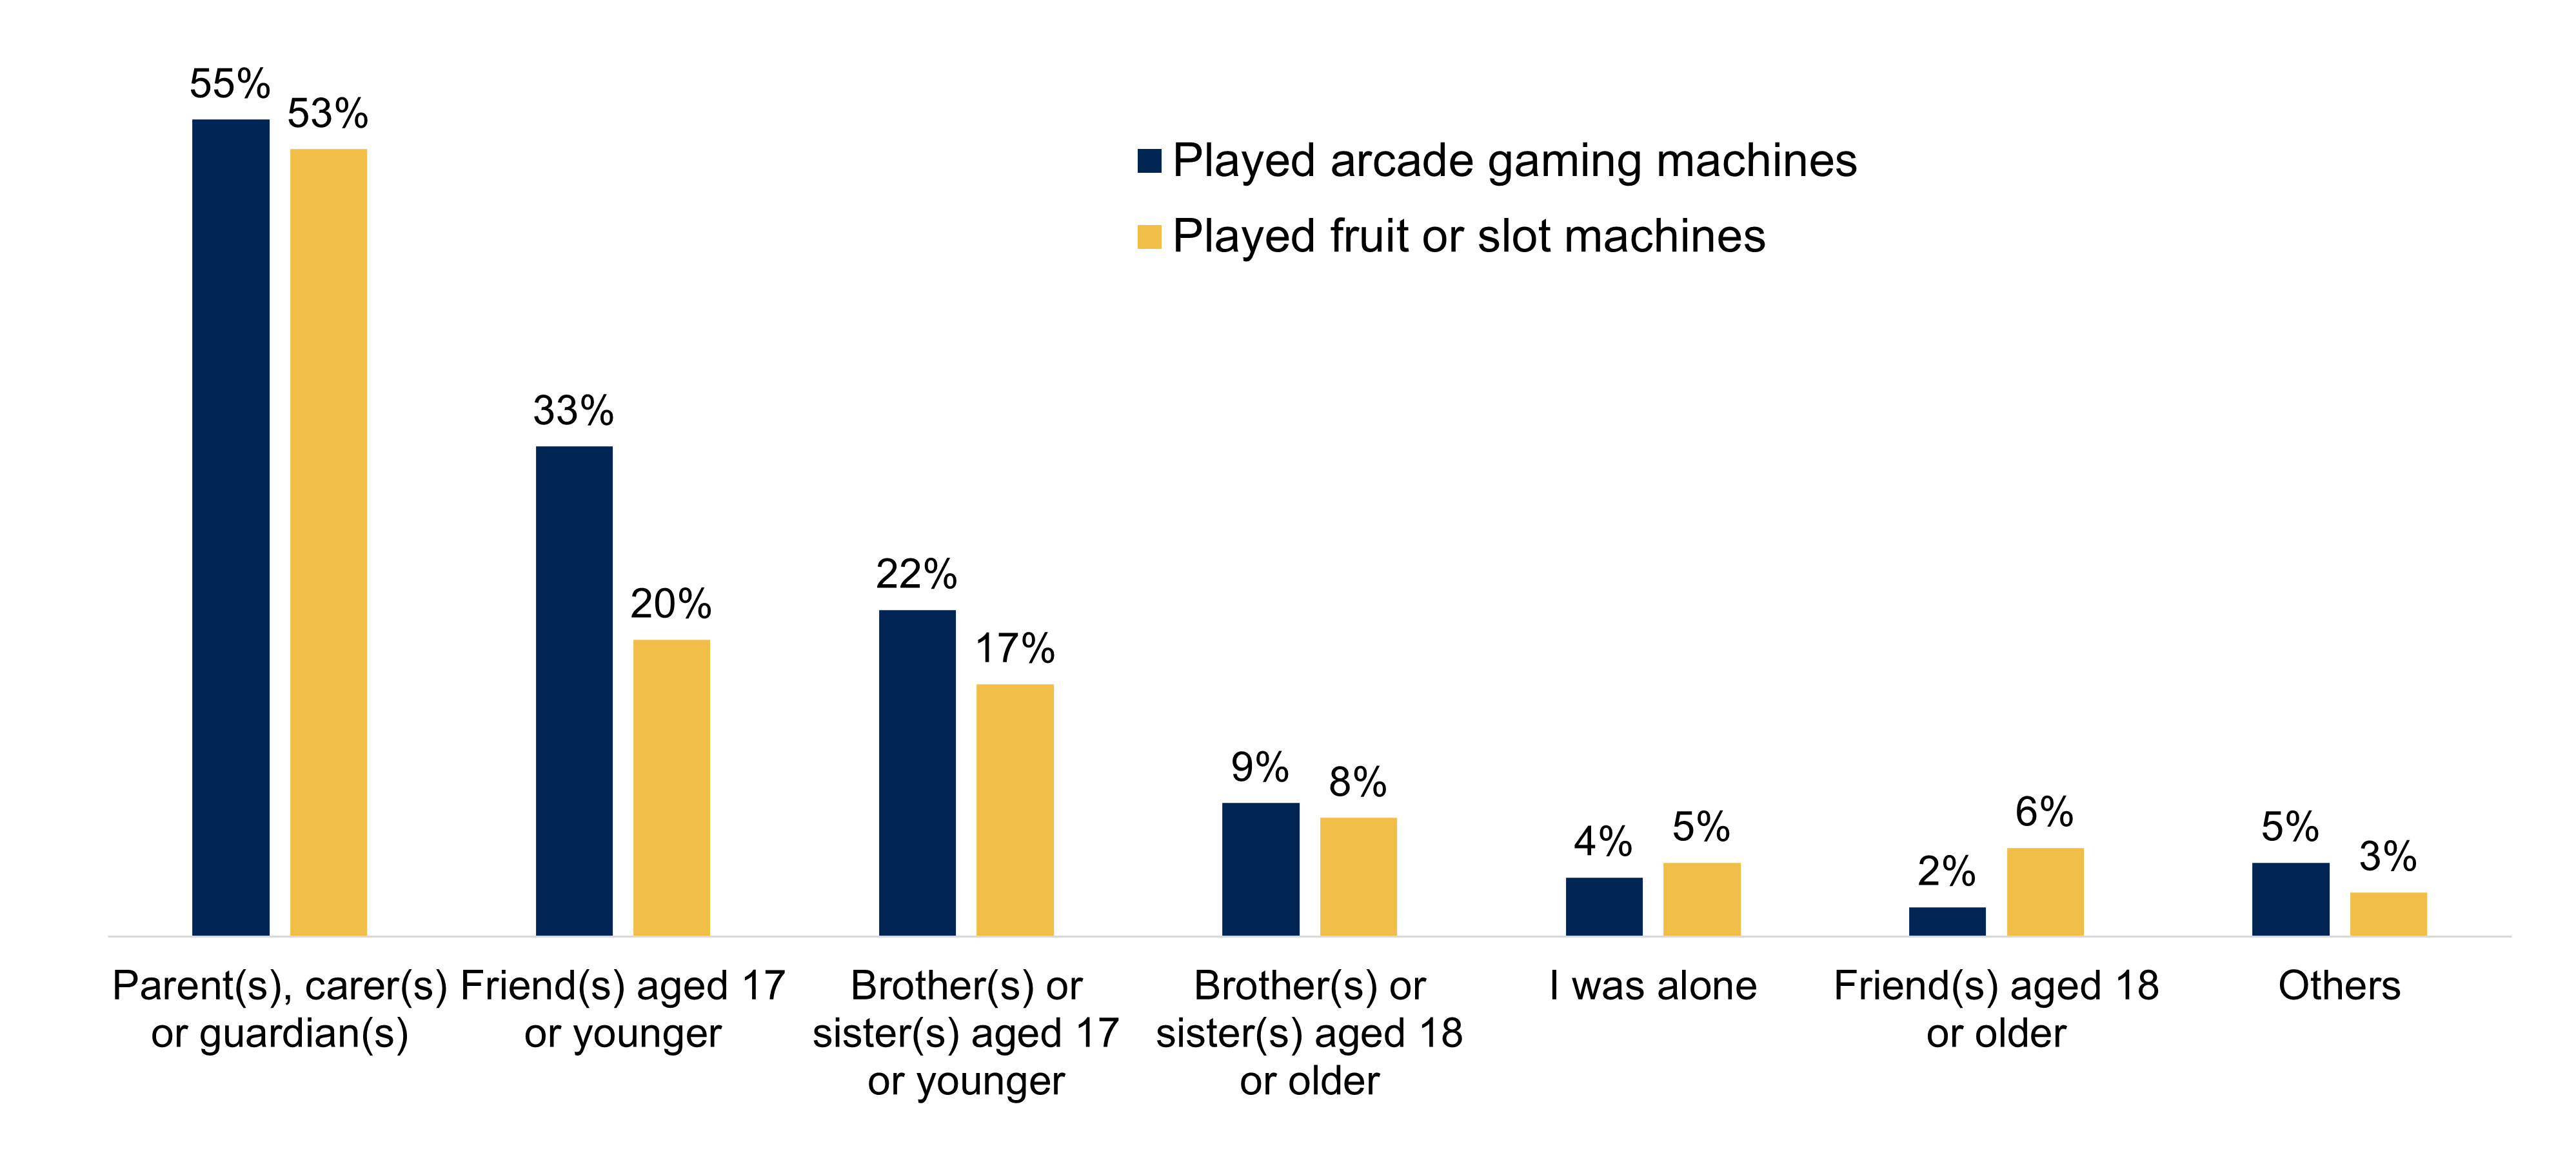
Figure 18 information
GAMSPEND2. Last time you did [this activity and/or these activities] who were you with?
Base: All 11 to 17 year olds answering who have played arcade gaming machines (1,640), fruit or slot machines (403).
Note: This chart shows responses for two separate questions, so the total will not add up to 100 percent.
| Who young people were with when playing games and gaming machines | Percentage who were playing arcade gaming machines (multiple response question, therefore answers do not sum to 100 percent) | Percentage who were playing fruit or slot machine (multiple response question, therefore answers do not sum to 100 percent) |
|---|---|---|
| Parent(s), carer(s) or guardian(s) | 55% | 53% |
| Friend(s) aged 17 years old or younger | 33% | 20% |
| Brother(s) or sister(s) aged 17 years old or younger | 22% | 17% |
| Brother(s) or sister(s) aged 18 years old or older | 9% | 8% |
| Friend(s) aged 18 years old or older | 2% | 6% |
| I was alone | 4% | 5% |
| Others | 5% | 3% |
Types of gaming machines
Young people who had ever played on arcade gaming machines, fruit or slot machines or other gambling machines were asked what kinds of gaming machines they played. Of these young people, penny falls or penny pusher machines (73 percent) and claw or crane grab machines (70 percent) were the most played games.
Less commonly played were the fruit machine-style games where you win tickets to buy prizes (for example soft toys) (17 percent), and quiz game machines where you win small cash prizes or tickets to buy prizes (14 percent). Plays on fruit machine-style games where you win small cash prizes represented one in ten (10 percent).
Figure 19: Types of gaming machines played

Figure 19 information
FRUITTYPE. Thinking back to the last time you played on arcade gaming machines, fruit or slot machines, or other gambling machines, what sort of machine(s) did you play?
Base: All 11 to 17 year olds answering who have played arcade gaming machines or fruit and/or slot machines (1,651).
Note: This is a multiple response question, so the responses shown will not add up to 100 percent.
| Type of gaming machine played | Percentage (multiple response question, therefore answers do not sum to 100 percent) |
|---|---|
| Penny falls or penny pusher machines | 73% |
| Claw or crane grab machines | 70% |
| Fruit machine style games where you win tickets to ‘buy’ prizes | 17% |
| Quiz game machines – where you win small cash prizes or tickets to ‘buy’ prizes | 14% |
| Fruit machine style games where you win small cash prizes | 10% |
| Other | 2% |
| Don’t know | 8% |
Girls were more likely than boys to play penny falls or penny pusher machines (78 percent compared with 69 percent) as well as claw or crane grab machines (75 percent, compared with 66 percent). Penny pusher machines as well as claw or crane grab machines do however rank the highest of use in boys.
Those who define their ethnicity as white were more likely than young people from black or ethnic minority backgrounds to play penny falls or penny pusher machines (78 percent, compared with 54 percent). Those who are categorised as black or of an ethnic minority background are most likely to play claw or crane grab machines (72 percent).
There has been a slight decrease in the likelihood of claw or crane grab machines being the most played arcade games since 2022 (2 percentage point decrease from 72 percent). There has been an increase in girls playing on penny falls or penny pusher machines (4 percentage point increase from 74 percent in 2022).
Play in an adults-only area
Young people who recalled playing on arcade gaming machines were asked if they had ever done so in an adults-only area, for example in an amusement arcade or holiday park, or somewhere with a sign or sticker saying 18 years old or over.
Eight in ten (79 percent) had not played arcade gaming machines in an adults-only area. However, one in ten (10 percent) had done so, and a similar proportion (11 percent) were unsure. Playing in an adults-only area was more prevalent amongst young people who had seen their family members gamble (13 percent) compared with those who had not (6 percent).
Frequency of gambling also had an impact, with those having experienced gambling in the last 7 days being more likely than those experiencing gambling in the last four weeks to have played arcade gaming machines in an adult only area (22 percent, compared with 17 percent).
The proportion of young people who had played arcade gaming machines in an adults-only area remained consistent since 2022 (10 percent), while uncertainty about whether or not they had played in an adults-only area marginally increased from 10 percent to 11 percent.
Figure 20: Playing machines in an adults-only area
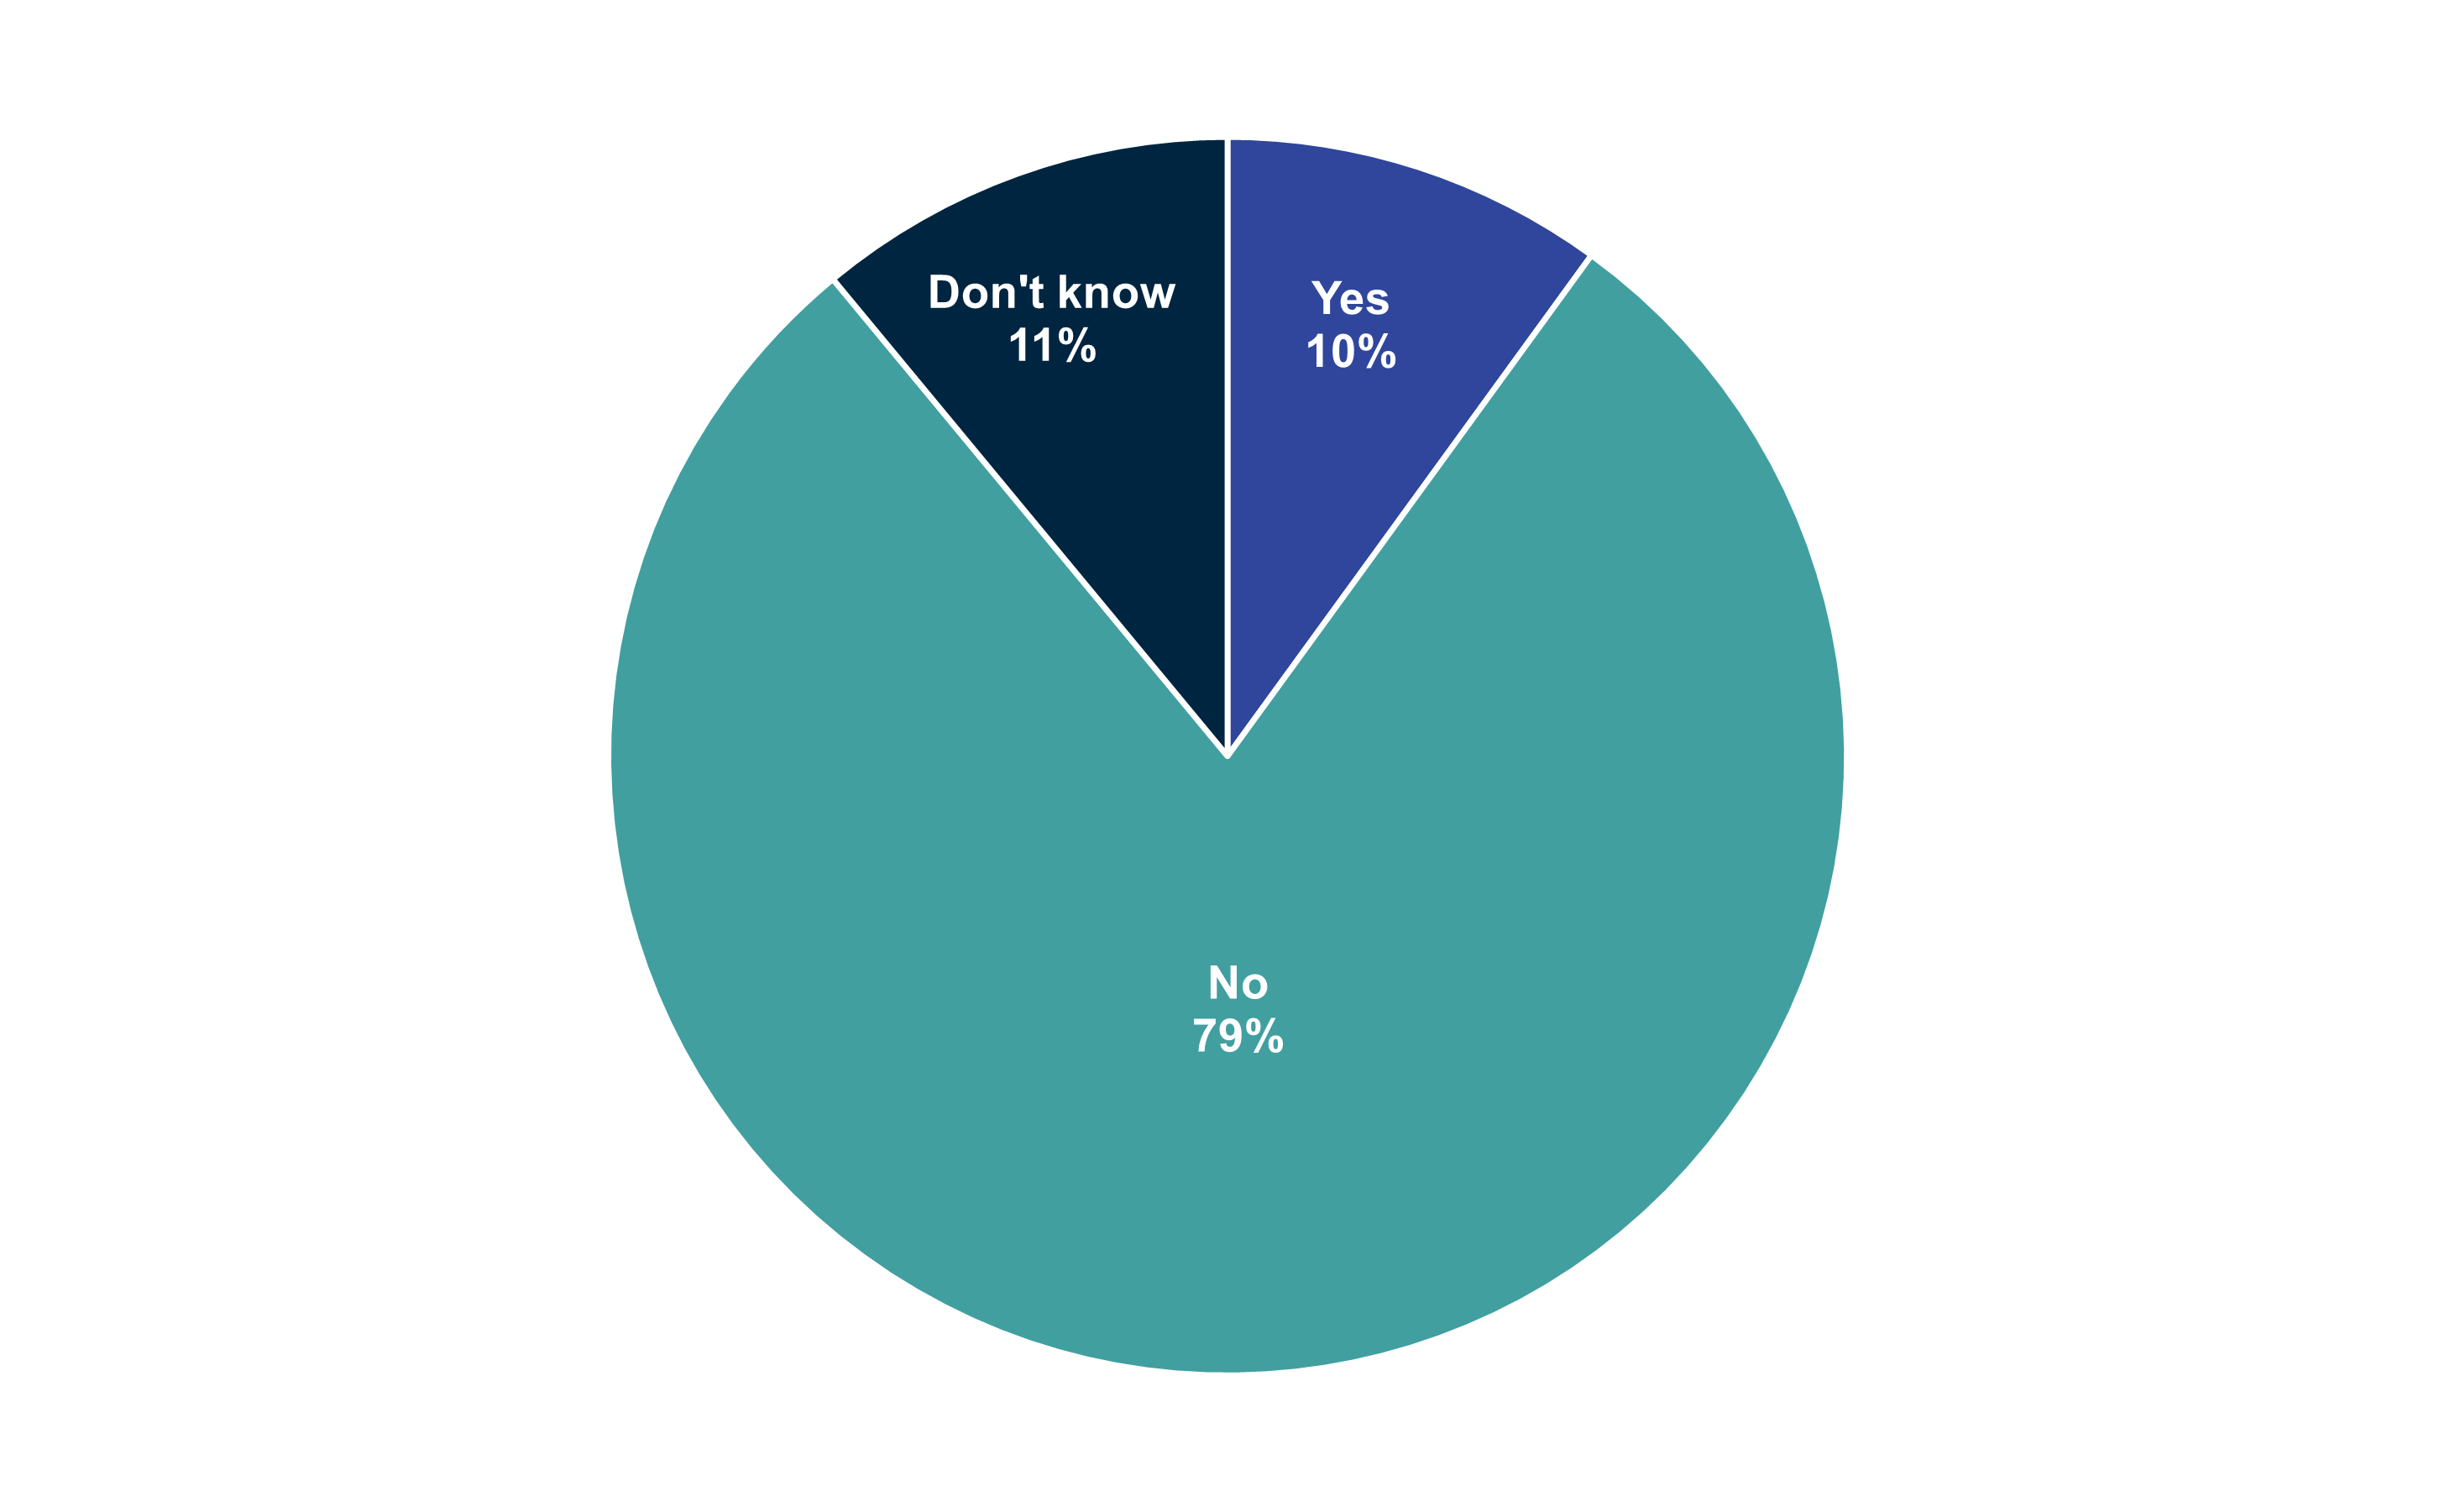
Figure 20 information
FRUITWHERE. As far as you know, have you ever played on any of these machines in an adults-only area. For example, an adult (18 years old and plus) only section of an amusement arcade, bowling alley, holiday park or pub.
Base: All 11 to 17 year olds answering who have played arcade gaming machines or fruit and/or slot machines and know machine played (1,468).
| Playing arcade gaming machines in an adults-only area | Percentage |
|---|---|
| Yes | 10% |
| No | 79% |
| Don't know | 11% |
The Context for gambling participation
Summary
This section of the report maps out gambling participation in the context of other risk-taking behaviours (such as smoking, drinking and drug-taking), and other activities that young people like to do in their spare time. It highlights both the reasons why young people choose to gamble and why they do not. As well as looking at who young people gamble with and any experiences of being stopped from gambling.
Throughout this chapter we make comparisons to the data in 2022. However, it should be noted that the 2022 sample did not include year 12 pupils or independent schools, so any differences are indicative only.
Across the last 12 months, (40 percent) of 11 to 17 year olds had experienced some form of gambling. This is a higher proportion than those who participated in other risk-taking behaviours, such as vaping (20 percent); smoking a cigarette (9 percent) or using illegal drugs (8 percent). However, the most common behaviour was drinking an alcoholic drink (42 percent).
It is important to note the context for gambling: most (74 percent) young people who have ever spent their own money on gambling were with their parents or guardians at the time and say they did so for fun (80 percent).
In contrast, a lack of interest in gambling (44 percent) is the most common reason for not gambling, followed by the recognition that it is illegal for young people to gamble (37 percent).
Setting gambling in the context of other risk-taking behaviours
To set the findings for gambling participation in context, young people were asked about their involvement in other potentially harmful activities, such as drinking, drug-taking and smoking.
Over the last 12 months, young people were more likely to have drunk alcohol than participated in other risk-taking behaviours, as shown in Figure 21. While this is closely followed by 40 percent of young people who have experienced gambling, fewer participants had spent their own money on gambling (26 percent). Two in five young people (42 percent) have drunk an alcoholic drink in the last twelve months; two in five young people have gambled (40 percent), one in five (20 percent) used an e-cigarette or vaped, 9 percent smoked a tobacco cigarette and 9 percent took an illegal drug.
In 2022, young people were mostly likely to have experienced some form of gambling activity than any other risk-taking behaviours (decrease by 10 percentage points from 50 percent). While drinking alcohol is now the most common risk-taking behaviour, it has only seen a 1 percent increase compared to 2022 (41 percent).
Figure 21: Participation in risk-taking behaviours in past 12 months

Figure 21 information
GC_GAMSPEND. When did you last do this activity? Was it...? Summary of gambling in the last 7 days, 4 weeks or 12 months
Base: All 11 to 17 year olds (3,453)
GC_ACTIVITY. Please look at the list below and for each activity, select when, if ever, you have done this.
Base: All 11 to 17 year olds answering who have taken illegal drugs (2,662), drunk alcoholic drink (2,622), smoked tobacco cigarette (2,665), used an e-cigarette and/or vape (2,637).
Note: Charts shows multiple questions, so responses will not sum to 100 percent.
Across all risk-taking behaviours the participation rate was higher for the older age groups, which is not unexpected as young people approach the legal age for some of these activities. However, there are notably higher levels of participation in some risk-taking behaviours among young people who have gambled with their own money in the week prior to taking part in the research. Over two thirds (67 percent) drank an alcoholic drink, 39 percent used an e-cigarette or vaped, 27 percent smoked a cigarette and 20 percent tried an illegal drug.
| Participation in risk-taking behaviours in past 12 months | Percentage (answers do not sum to 100 percent) |
|---|---|
| Drunk an alcoholic drink | 42% |
| Had an experience in gambling | 40% |
| Been actively involved in gambling | 26% |
| Used an e-cigarette and/or vape | 20% |
| Smoked a tobacco cigarette | 9% |
| Taken illegal drugs (including cannabis) | 8% |
Setting gambling in the context of other activities
Young people were also asked about the types of activities they most like to do in their spare time. When asked to indicate the three activities they like to do most, listening to music (40 percent) and meeting up with friends (39 percent) were most frequently mentioned.
However, the use of devices shapes the way in which many young people spend their free time, with three in ten (30 percent) playing games on their phone, iPad, laptop or on a console. For boys it is the most popular activity, with 47 percent playing games on devices in their spare time, compared with just 12 percent of girls. The youngest group in the survey, 11 to 13 year olds, are more likely to report spending time on playing games on devices (33 percent, compared with 30 percent overall).
The most popular activity mentioned by girls was listening to music (48 percent, compared with 31 percent of boys). Girls were also more likely to report spending time on social media than boys (32 percent, compared with 21 percent of boys). Overall, over a quarter of young people (26 percent) felt that spending time on social media was the activity that they liked to do most in their free time.
Spending time with the family (25 percent), taking part in team sports (21 percent) and chatting on the phone with friends (19 percent) were other activities which made it into the list of top ten popular activities, as shown in Figure 22.
Just 2 percent of young people reported spending time watching others play esports online, with boys being more likely to take part in this activity (3 percent). While 1 percent of young people reported spending time taking part in fantasy football leagues, again with boys being more likely to take part in this activity (2 percent).
Figure 22: In your spare time, what are the things that you like to do most - Top ten responses

Figure 22 information
GC_SPARE. In your spare time, what are the things that you like to do most?
Base: All 11 to 17 year olds answering (3,442)
Note: Multiple response question so the percentages in the chart and table do not sum to 100 percent
| Spare time activities – top ten responses | Percentage (multiple response question, answers do not sum to 100 percent) |
|---|---|
| Listening to music | 40% |
| Meeting up with friends | 39% |
| Playing games on my phone, iPad, laptop or console | 30% |
| Spending time on social media | 26% |
| Spending time with family | 25% |
| Taking part in team sports | 21% |
| Chatting on the phone with friends | 19% |
| Exercising and/or keeping fit | 18% |
| Shopping | 13% |
| Watching programmes on TV and/or streaming services | 13% |
Reasons why young people gamble
Most (78 percent) young people who spent their own money gambling in the last 12 months, did so because they regard it as a fun thing to do (Figure 23). This is by far the most common reason given for gambling.
However, the prospect of winning money is a key driver for some young people: Over one third (35 percent) gambled because they felt they had a good chance of winning something (even if not a big prize), while one quarter (25 percent) said they gambled because they thought they could win a jackpot or big prize. Almost one third (32 percent) said they gambled with the intention of winning money.
For three in ten (29 percent) young people, their reason for gambling was the simplicity of the games they played. A similar proportion cited that it gave them something to do (28 percent).
Figure 23: Thinking about when you have spent your money on... in the last 12 months, why did you do this?

Figure 23 information
GC_SPENDWHY. Thinking about when you have spent your money on ... in the past 12 months, why did you do this?
Base: All 11 to 17 year olds (answering) who spent their own money in the last 12 months on... (879).
Note: This is a multiple response question, so the responses shown will not add up to 100 percent
| Reasons for gambling – top ten responses | Percentage (multiple response question, therefore answers do not sum to 100 percent) |
|---|---|
| Because it's fun | 78% |
| I have a good chance of winning something (even if not a big prize or jackpot) | 35% |
| To try to win money | 32% |
| The games are simple to play | 29% |
| It gives me something to do | 28% |
| I have a chance to win a jackpot or big prize | 25% |
| To get a buzz and/or because it is exciting | 21% |
| Because I like to take risks | 19% |
| Because it helps me and/or cheers me up when I feel down, nervous or in a bad mood | 14% |
| Because it's cool | 12% |
Why young people do not gamble
Figure 24: Reasons for not gambling
A lack of interest in gambling is the most common reason cited by young people for never spending their own money on it (44 percent).
However, a similar proportion did not participate in gambling activities because it is illegal or thought they were too young (37 percent). This was followed by young people not wanting to play with real money and/or they would rather play with free games (27 percent); because they think they will lose more than they will win (24 percent), and because it may lead to future problems (23 percent).

Figure 24 information
GC_NEVER. You said that you have never gambled or never spent your own money on gambling. Why is that?
Base: All 11 to 17 year olds answering who have never spent their own money on gambling (1,674).
Note: This is a multiple response question, so the responses shown will not add up to 100 percent
| Reasons for not gambling | Percentage (multiple response question, therefore answers do not sum to 100 percent) |
|---|---|
| It’s not something I’m interested in | 44% |
| It’s illegal and/or I’m too young to do this | 37% |
| I don’t want to play with real money and/or I would rather play free games | 27% |
| Because I will lose more than I will win | 24% |
| Because it might lead to future problems | 23% |
| My parents would not want me to and/or allow me to | 22% |
| Because I am not likely to win money | 21% |
| I don’t agree with gambling and/or it is not right | 20% |
| I don’t know enough about these gambling games | 13% |
| It is against my religion | 8% |
| Prefer not to say | 36% |
| Other | 4% |
| Don't know | 11% |
There were gender differences with boys more likely than girls to say that they will lose more than they will win (24 percent compared with 19 percent), that it might lead to future problems (27 percent compared with 20 percent) and that they are not likely to win any money (26 percent compared with 16 percent).
There were also age differences: 11 to 13 year olds were more likely to mention that their parents do not allow them to gamble, than 14 to 16 year olds (25 percent, compared with 19 percent), and were more likely to state that they did not agree with gambling, than 14 to 16 year olds (22 percent, compared with 17 percent). Those aged 17 were more likely than those aged 14 to 16 to state that they don’t agree with gambling and/or that it is not right (25 percent compared to 17 percent).
Young people from ethnic minority groups were more likely, than those who define their ethnicity as white, to cite reasons such as gambling being against their religion (26 percent, compared with 2 percent) and that they are not likely to win any money (22 percent compared with 16 percent).
There has been an increase of 5 percentage points in the overall lack of interest in gambling in comparison to 2022 (from 39 percent). The proportion of young people aged 11 to 13 years old who mentioned that their parents do not allow them to gamble has decreased by 4 percentage points (29 percent in 2022).
Who young people were with when they gambled
Most (74 percent) young people who have experience of gambling were with their parents or guardians the last time they did so. Young people are rarely alone when they gamble; as shown in Figure 25, 39 percent were with their friends aged 17 or under and 27 percent were with siblings or friends aged 17 or under.
Figure 25: Who young people were with when gambling
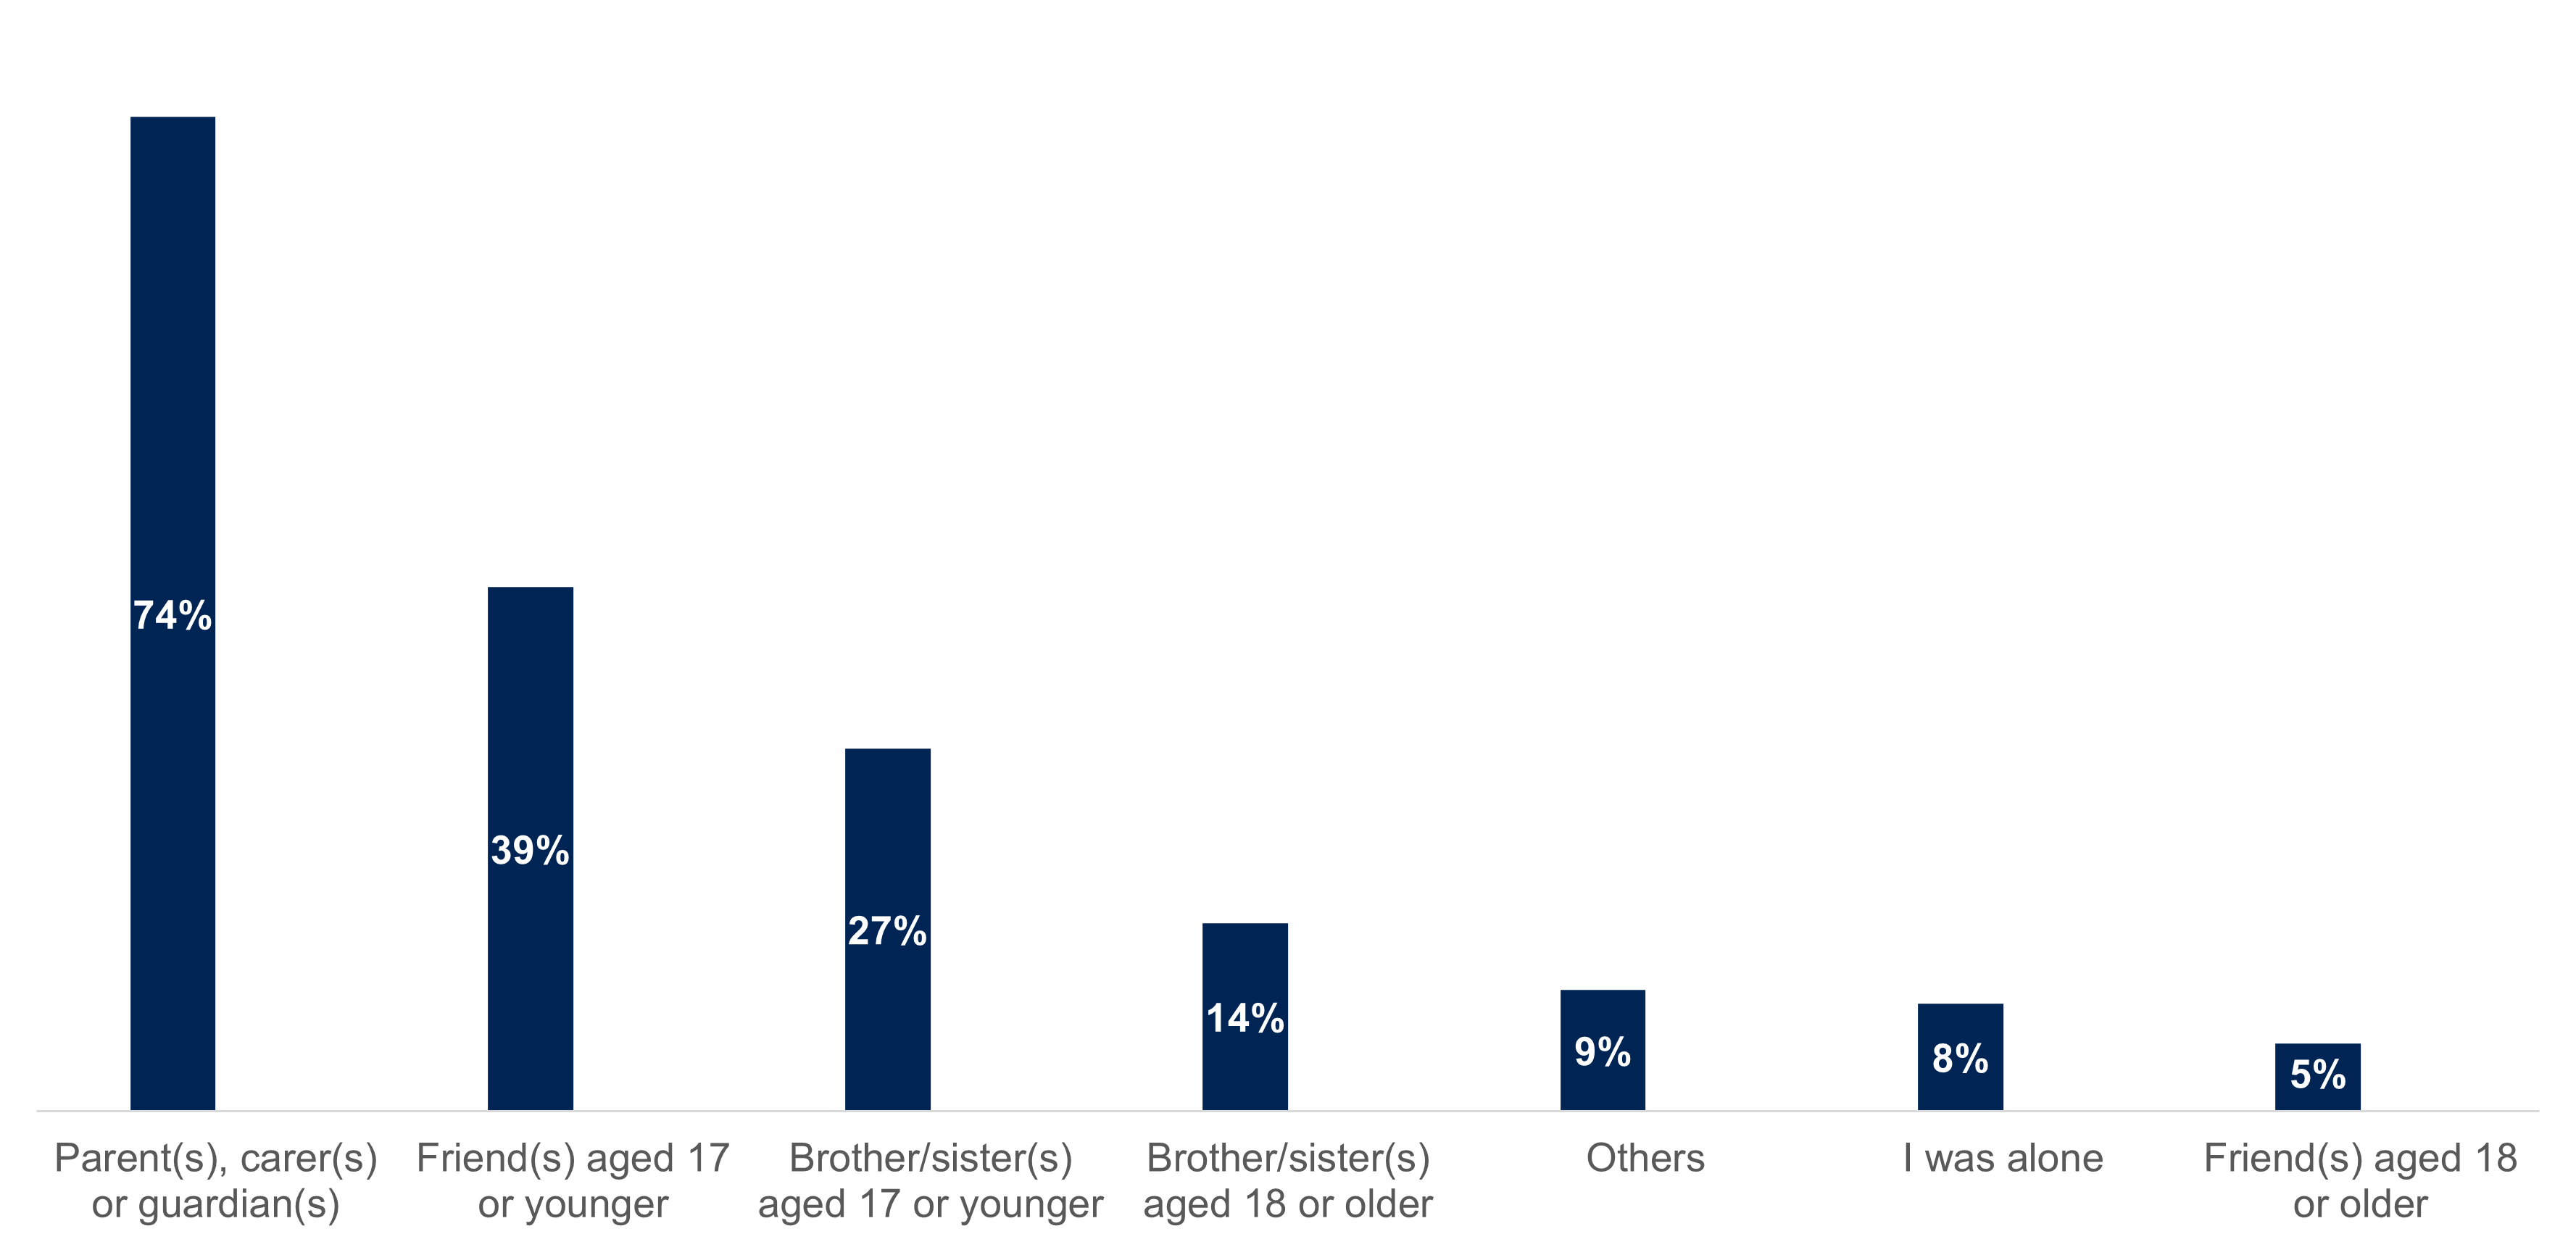
Figure 25 information
GAMSPEND2. Last time you did [this activity or these activities] who were you with?
Base: All 11 to 17 year olds answering who have played… (1,969).
Note: This is a multiple response question, so the responses shown will not add up to 100 percent.
| Who young people were with when gambling | Percentage (multiple response question, therefore answers do not sum to 100 percent) |
|---|---|
| Parent(s), carer(s) or guardian(s) | 74% |
| Friend(s) aged 17 or younger | 39% |
| Brother or sister(s) aged 17 or younger | 27% |
| Brother or sister(s) aged 18 or older | 14% |
| Others | 9% |
| I was alone | 8% |
| Friend(s) aged 18 or older | 5% |
Playing National Lottery scratchcards (77 percent); placing a bet at a betting shop or bookies (73 percent) or on a betting website or app (71 percent) were among the gambling activities that young people were most likely to do in the company of their parents or guardians.
Playing casino games online (36 percent) and placing a bet on e-Sports (32 percent) were the gambling activities that young people were more likely to do alone. However, due to online age verification it is likely to be the case that young people were taking part in free to play games that are similar to casino or bingo games.
Playing National Lottery scratchcards was also the most likely gambling activity for young people to take part in with their parents, carers or guardians in 2022. Playing casino games online was also the most likely gambling activity for young people to take part in alone in 2022, however the second most likely activity for young people to take part in alone was playing bingo online.
Attitudes towards and exposure to gambling
Summary
This section looks at young people’s attitudes towards gambling, including what they think about gambling participation among people their age and who they would go to for help if they had problems with gambling. It also explores young people’s exposure to gambling through advertising, sponsorships, and social media.
Throughout this chapter we make comparisons to the data in 2022. However, it should be noted that the 2022 sample did not include year 12 pupils or independent schools, so any differences are indicative only.
The majority of young people (64 percent) agreed that gambling was dangerous. Indeed, only one in ten (14 percent) felt that it was something you should even try, just to see what it is like, and fewer still (7 percent) felt that is was OK for someone their age to gamble once a week.
Most (70 percent) felt informed about the risks of gambling. However, only half (54 percent) said that someone had spoken to them about the potential risks associated with gambling.
More than half of young people (55 percent) reported that their exposure to adverts or promotion about gambling happens offline, typically when watching TV (47 percent). A similar proportion (53 percent) have seen gambling adverts online either on an app (45 percent), on social media websites (40 percent), or on live streaming or video sharing platforms (30 percent). Young people who had seen or heard an advert were most likely to recall it being about ‘lotteries’ (43 percent), betting (36 percent) or bingo (35 percent).
Despite being exposed to gambling on TV, online or through other media sources, most (81 percent) young people who had seen or heard adverts about gambling said that it did not prompt them to spend money on gambling. However, 15 percent said that they had chosen to follow or watch gambling companies on social media websites.
Young people's views on gambling
Young people were asked whether they agreed or disagreed with statements about gambling and provided with a prompted list to remind them of the activities included in the definition of ‘gambling’ for the purposes of the survey. Most young people felt that gambling was dangerous (64 percent).
Those from Black, Asian and minority ethnic groups were more likely to feel that gambling is dangerous (69 percent) compared to those from white ethnic groups (63 percent). Young people who had not seen family members gamble were more likely to feel that it was dangerous (71 percent), than those who had seen family members gamble (58 percent).
Only a minority of 11 to 17 year olds appeared to support young people being able to gamble. Around one in ten agreed that it is okay for people their age to gamble to see what it’s like (14 percent) and that it was okay for someone their age to gamble once a week (8 percent). Even fewer young people agreed that most people their age gambled (7 percent).
In comparison to 2022, the proportion of young people who agreed that gambling is dangerous increased by 6 percentage points amongst those from ethnic minority groups. There has also been a 2 percentage point increase in young people agreeing that it is okay for someone their age to try to gamble to see what it’s like (from 12 percent), and a 2 percentage point increase in young people agreeing that it’s okay for others their age to gamble once a week (6 percent in 2022).
Figure 26: Young people’s views on gambling
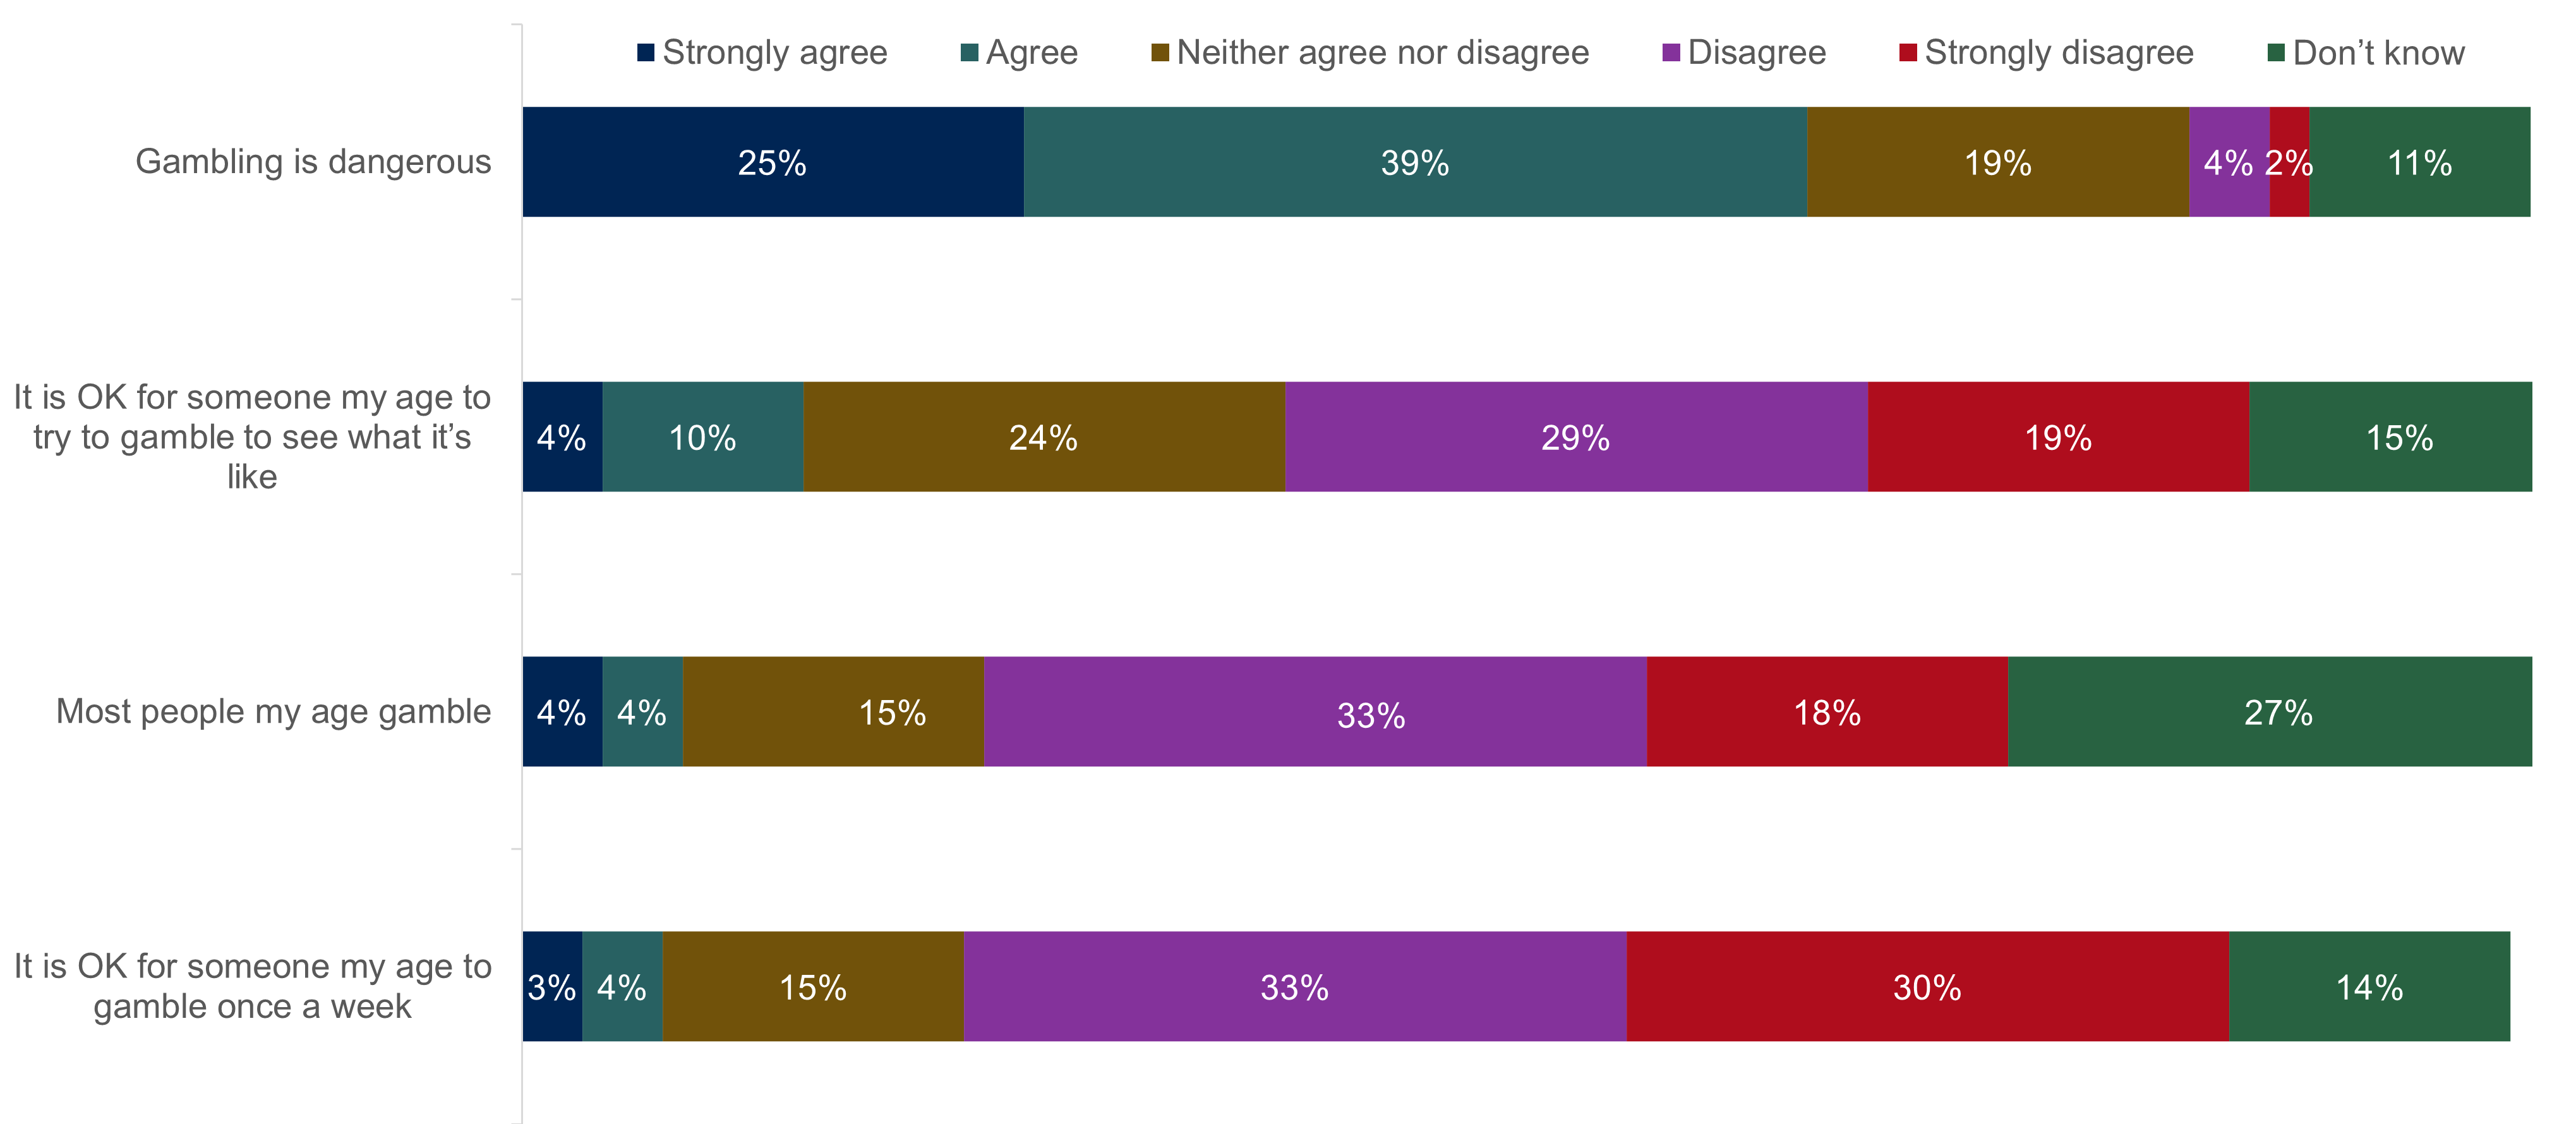
Figure 26 information
GC_ATTMOST GC_ATTDANG GC_ATTOKONCE GC_ATTOKTRY. Thinking about gambling for money, how strongly do you agree or disagree with the statements below?
Base: All participants answering 'Most people my age gamble' (2,671). 'Gambling is dangerous' (2,667). 'I feel well informed about the risks of gambling' (2,667). 'It is OK for someone my age to try to gamble to see what it’s like' (2,660). 'It is OK for someone my age to gamble once a week' (2,660). 'People have spoken to me about the potential problems that gambling can lead to' (2,665).
| Young people’s views on gambling | Percentage who strongly agree | Percentage who agree | Percentage who neither agree or disagree | Percentage who disagree | Percentage who strongly disagree | Percentage who do not know |
|---|---|---|---|---|---|---|
| Gambling is dangerous | 25% | 39% | 19% | 4% | 2% | 11% |
| It is OK for someone my age to try to gamble to see what it’s like | 4% | 10% | 24% | 29% | 19% | 15% |
| Most people my age gamble | 4% | 4% | 15% | 33% | 18% | 27% |
| It is OK for someone my age to gamble once a week | 3% | 4% | 15% | 33% | 30% | 14% |
Young people with active involvement in gambling with their own money in the seven days leading up to the survey were, perhaps unsurprisingly, more likely to agree that most people their age gamble (19 percent, compared with 7 percent overall), accept that it is okay for someone their age to gamble to see what it is like (34 percent, compared with 14 percent overall ) and to gamble once a week (24 percent, compared with 8 percent overall). Acceptance of gambling is higher amongst those aged 16 years old than those aged 11 to 13 years old, with 20 percent of 16 year olds agreeing that it is okay for someone their age to try gambling, compared to 12 percent of 11 to 13 year olds. 16 percent of 17 year olds agree that it is okay for someone their age to try gambling, indicating that while acceptance of gambling is higher for 16 year olds, acceptance of gambling does not necessarily increase with age.
Young people who have observed family members gambling were more likely to have felt that most people their age gamble (10 percent, compared with 5 percent of those who have not seen family members gamble) and they were more likely to agree that it is okay to try gambling to see what it is like (24 percent, compared with 10 percent of those who have not seen anyone in their family gamble).
Compared to 2022, the percentage who agreed that most people their age gamble increased by 4 percentage points for young people who had spent their own money on gambling in the last 7 days (to 19 percent from 15 percent). There was also a 5 percentage point increase for those who agreed that it is okay for other young people to try gambling to see what it is like for young people who had spent their own money on gambling in the last 7 days (to 34 percent from 29 percent). Additionally, the proportion who agree that it is okay to try gambling to see what it is like has increased by 4 percentage points for young people who have observed family members gambling (from 24 percent to 20 percent).
Feeling informed about gambling
Most young people (70 percent) agreed that they were well informed about the risks of gambling, with boys (72 percent) being more likely than girls (67 percent) to feel well informed.
Just over half (54 percent) of 11 to 17 year olds reported that someone had spoken to them about the potential problems of gambling. Boys (57 percent) were more likely to report that they had been spoken to about the potential problems, than girls (52 percent), which is consistent with the finding about feeling better informed about gambling risks.
Young people who had experience of gambling in the last 12 months were more likely to agree that someone had spoken to them about the potential problems that gambling can lead to than young people overall (58 percent, compared with 54 percent) and felt more informed (74 percent, compared with 70 percent).
No significant differences were highlighted by age or ethnicity.
The proportion of 11 to 17 year olds who reported that someone had spoken to them about the potential problems of gambling has increased by 4 percentage points since 2022 (50 percent in 2022). There has been a significant increase in girls who have been spoken to about the potential problems of gambling (7 percentage points increase from 45 percent) and 3 percentage points increase in boys (54 percent).
Figure 27: Feeling informed about gambling
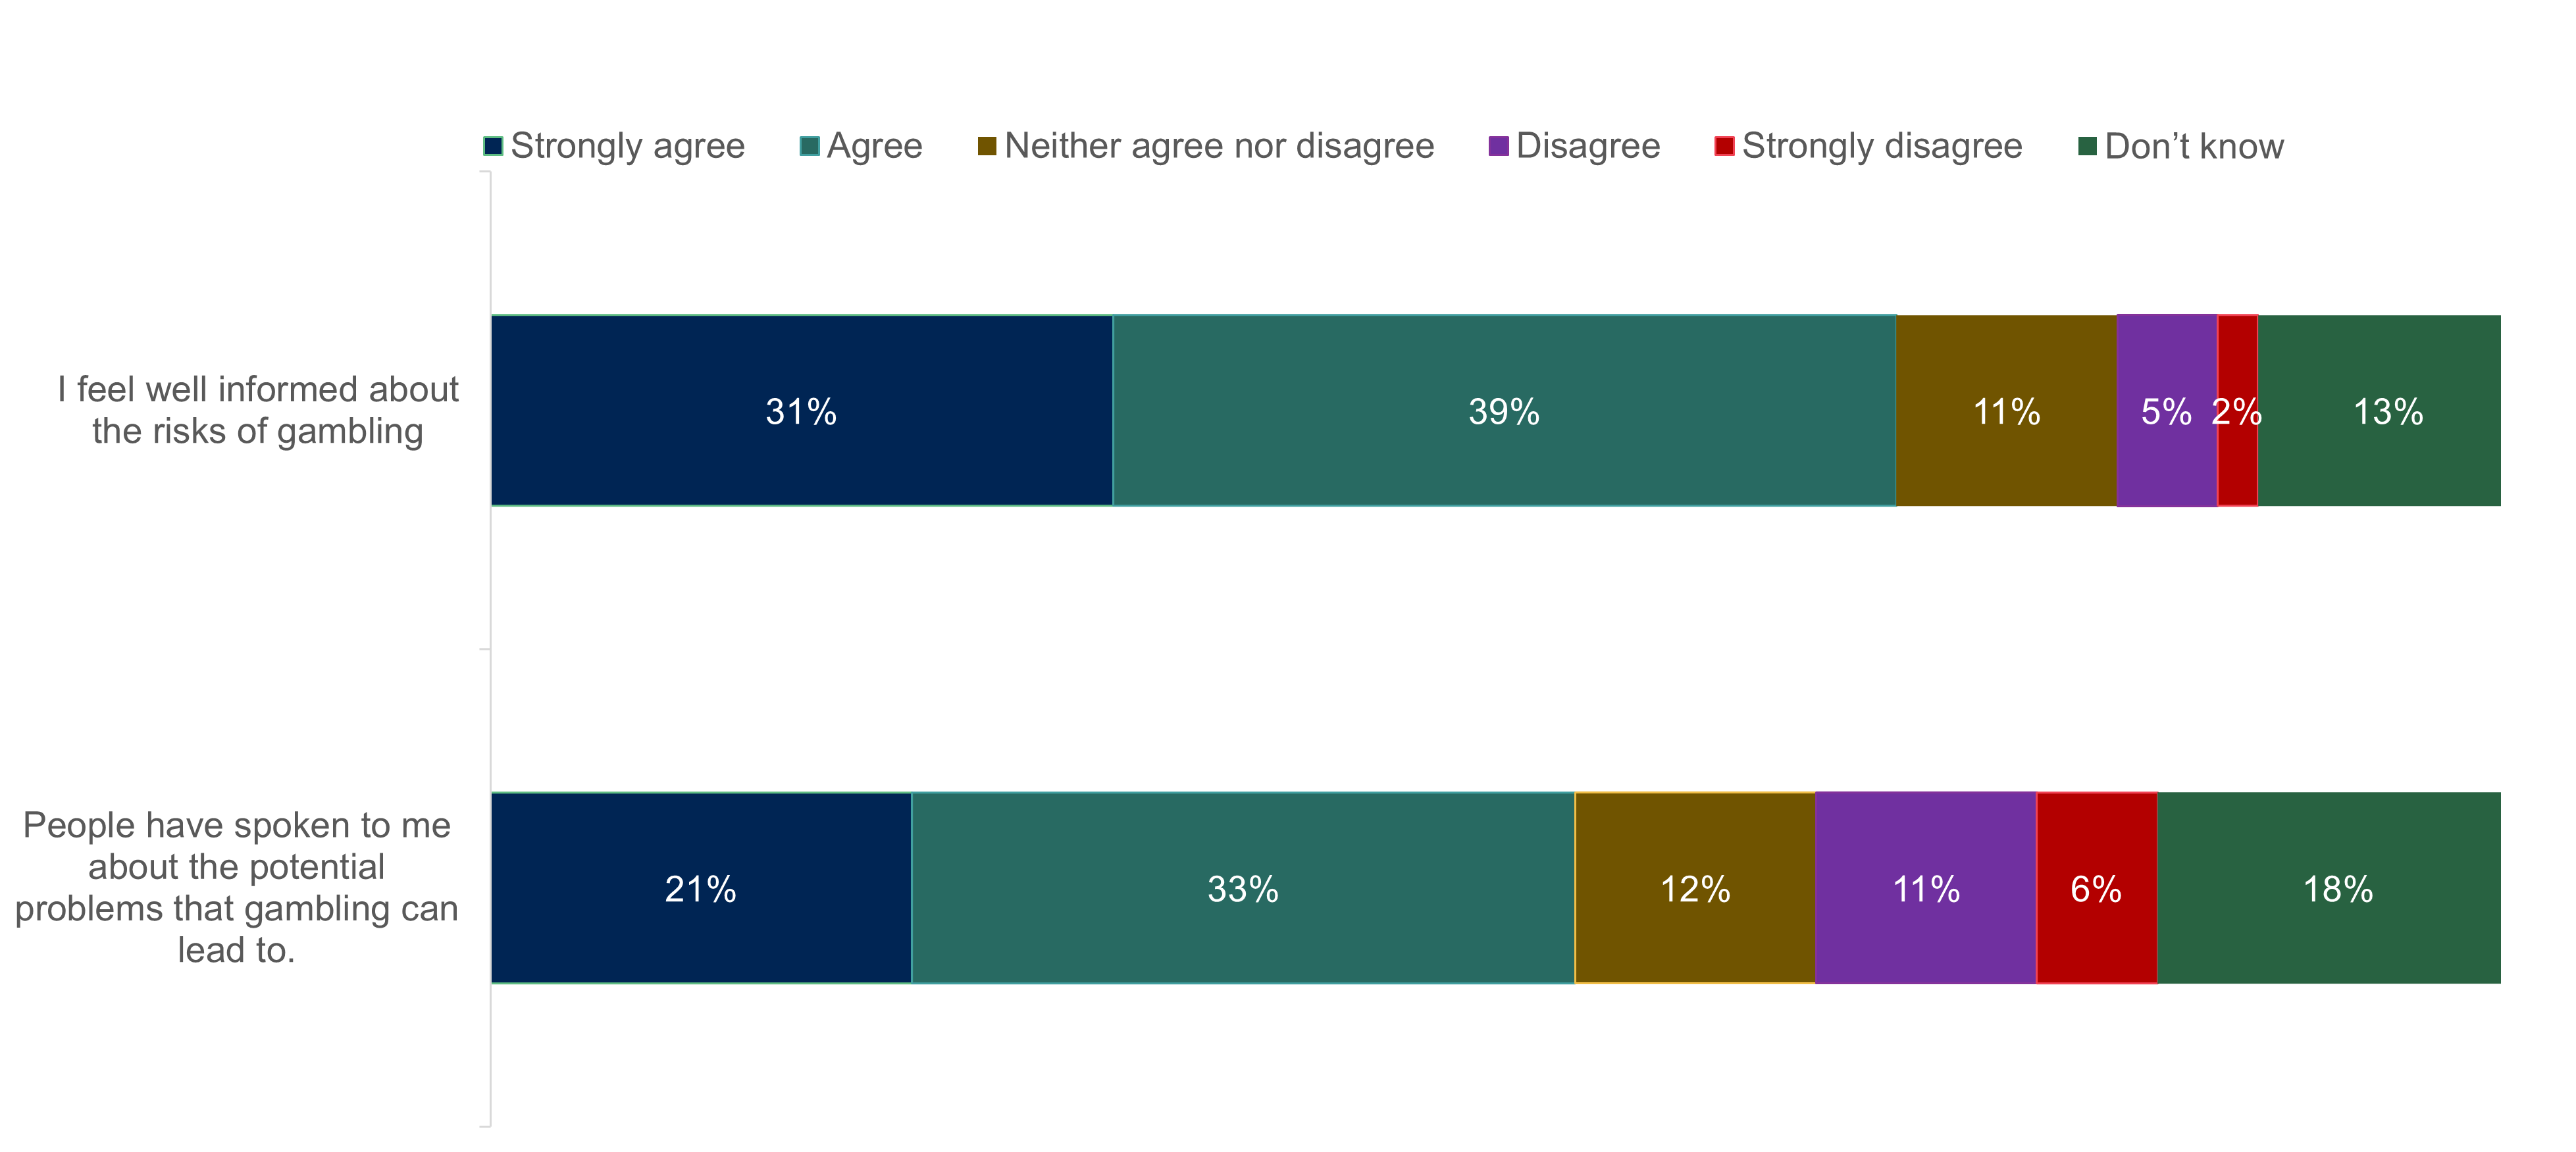
Figure 27 information
GC_ATTSPOKEN. GC_ATTINF. Thinking about gambling for money, how strongly do you agree or disagree with the statements below?
Base: All participants answering 'I feel well informed about the risks of gambling' (2,667). 'People have spoken to me about the potential problems that gambling can lead to' (2,655).
| Feeling informed about gambling | Percentage who strongly agree | Percentage who agree | Percentage who neither agree or disagree | Percentage who disagree | Percentage who strongly disagree | Percentage who don't know |
|---|---|---|---|---|---|---|
| I feel well informed about the risks of gambling | 31% | 39% | 11% | 5% | 2% | 13% |
| People have spoken to me about the potential problems that gambling can lead to | 21% | 33% | 12% | 11% | 6% | 18% |
Being stopped from gambling
All young people, regardless of gambling experience, were asked whether they had ever been stopped from gambling because they were too young.
If we exclude those who have never tried to gamble, overall 12 percent of young people reported being stopped from gambling because of their age, both from gambling in a premises and online. This result is consistent from findings from 2022.
Boys were more likely to have been stopped than girls (16 percent, compared with 8 percent) as were young people with experience of gambling in the last seven days (19 percent).
Young people's exposure to gambling adverts and promotions and frequency of exposure
The survey also explored the extent to which young people are exposed to gambling advertising, sponsorships, social media activity and direct marketing.
The proportion of young people who have seen adverts or promotion linked to gambling offline or online is similar (55 percent, and 53 percent, respectively). Offline, the most reported form of exposure is when watching TV (47 percent) or being at a sports event (35 percent). Online, 11 to 17 year olds were most likely to see gambling adverts on an app (45 percent), on social media (40 percent), on live streaming or video sharing platforms (30 percent), or on a website other than social media (28 percent ). An additional option was added this year, for having heard or seen adverts through a podcast, which 13 percent of respondents selected.
Overall, young people’s exposure to gambling adverts and promotions has declined in comparison to 2022. The proportion of young people who have seen adverts or promotion linked to gambling offline or online has seen a decrease in comparison to 2022 (11 percent from 66 percent, and 10 percent from 63 percent, respectively). Exposure when watching TV has decreased by 10 percentage points (57 percent) or being at a sports event has decreased by 2 percentage points (37 percent). Overall online exposure has also seen a decline, 9 percentage point decrease for gambling adverts on an app (54 percent), on live streaming or video sharing platforms by 6 percentage points (36 percent) or on a website or other social media by 7 percentage points (35 percent).
Figure 28: Exposure to gambling adverts – chart shows ‘yes’ responses when asked whether seen or heard adverts or promotions
Figure 28 information
GC_ADAWARE. Have you seen or heard adverts or promotion about gambling in any of the following places?
Base: All participants answering each type of advertising.
Note: This is a multiple response question, so the responses shown will not add up to 100 percent.
| Exposure to gambling adverts | Percentage (multiple response question, answers do not sum to 100 percent) |
|---|---|
| Gambling adverts offline | 55% |
| Gambling advert online | 53% |
| Exposure to gambling adverts | Percentage who have seen and/or heard gambling adverts (multiple response question, therefore answers do not sum to 100 percent) |
|---|---|
| On television (TV) | 47% |
| On an app | 45% |
| On social media (including Snapchat, Facebook, Twitter, Instagram, TikTok) | 40% |
| At a sports event (for example at football stadiums or on players' shirts or around the pitch) | 35% |
| On posters and/or billboards | 32% |
| On live streaming or video sharing platforms (including Twitch, YouTube) | 30% |
| In newspapers or magazines | 30% |
| On the radio | 29% |
| On another website | 28% |
| Somewhere else | 19% |
| On a podcast | 13% |
Overall, young people who had seen family members gambling were more likely than those who had not to have seen or heard adverts or promotions about gambling both offline (81 percent compared with 63 percent) and online (76 percent compared with 62 percent). The most notable difference for those who had seen family members gambling than those who had not was in exposure is at sports events (57 percent compared with 38 percent) and on TV (71 percent compared with 54 percent).
Young people who defined their ethnicity as white were more likely to report having seen or heard adverts or promotions about gambling across all forms of offline media, with the exception of posters and/or billboards, in comparison to all young people (57 percent compared with 55 percent) and to those from black and ethnic minority groups (49 percent).
Young people who recalled seeing or hearing adverts or promotion about gambling were then asked how often they see or hear them. As shown in Figure 29, approaching half of young people who were exposed to gambling adverts online, for example on social media (48 percent), apps (47 percent), or TV (45 percent), saw or heard them at least once a week. In contrast, those who saw gambling adverts offline, usually saw them less frequently.
Amongst young people who had seen family members gamble, exposure to adverts and promotions about gambling increased since 2022 by 3 percentage points for offline exposure and 6 percentage points for online exposure (78 percent and 70 percent in 2022, respectively ). There has also been an increase in offline exposure to adverts and promotions for young people with experience of gambling in the last 4 weeks, with an increase of 7 percentage points from 62 percent in 2022.
Young people from white ethnic backgrounds’ likelihood of reporting having seen or heard adverts or promotions about gambling across platforms offline has decreased by 10 percentage points, compared with 2022 (67 percent).
Figure 29: Frequency of seeing and/or hearing gambling promotions and/or adverts at least once a week

Figure 29 information
GC_ADFREQ. And how often, do you see or hear adverts or promotion about gambling in the following places?
Base: All participants answering 'On live streaming or video sharing platforms' (1,022). 'On an app' (1,563). 'On social media' (1,371). 'On the radio' (983). 'On TV' (1,626). 'On a podcast' (436) 'Somewhere else' (646). 'At a sports event' (1,164). 'On another website' (955). 'On posters or billboards' (1,076). 'In newspapers or magazines' (1,003).
Note: This is a multiple response question, so the responses shown will not add up to 100 percent.
| Frequency of seeing or hearing gambling promotions or adverts at least once a week | Percentage (multiple response question, answers do not sum to 100 percent) |
|---|---|
| On social media (including Snapchat, Facebook, Twitter, Instagram, TikTok) | 48% |
| On an app | 47% |
| On television (TV) | 45% |
| On the radio | 43% |
| Somewhere else | 42% |
| On live streaming or video sharing platforms (including Twitch, YouTube) | 41% |
| At a sports event (for example at football stadiums or on players' shirts or around the pitch) | 40% |
| On another website | 40% |
| On a podcast | 36% |
| On posters and/or billboards | 33% |
| In newspapers or magazines | 32% |
Overall, boys were more likely to have seen or heard gambling adverts or promotions on a frequent basis than girls, reflecting their greater exposure. For example, boys (48 percent) were more likely to see these adverts at sports events at least once a week than girls (30 percent). Similarly, the proportion of boys who said they had seen gambling adverts on live streaming or video sharing platforms at least once a week was higher than girls (46 percent, and 35 percent). The figures were similar for frequent exposure on apps (51 percent of boys, compared with 42 percent of girls).
Young people who have seen their own family members gamble were also more likely to have seen or heard gambling adverts or promotions on a frequent basis, compared to those who have not seen family members gamble.
There has been a 5 percentage points increase in exposure at sporting events for both boys and girls (43 percent of boys and 25 percent of girls in 2022), and an additional decrease in exposure on live streaming or video sharing platforms for both groups (7 percent from 53 percent of boys and 3 percent from 38 percent of girls).
Content of gambling adverts and promotions seen
Young people who had been exposed to gambling adverts or promotions were asked what the last one they had seen was about.
The research findings show that young people were most likely to recall seeing an advert or promotion about ‘lotteries’ (mentioned by 43 percent). Over one third recalled the last gambling advert they saw as being about betting (36 percent) or about bingo (35 percent) and three in ten remember it being about casinos (29 percent). However, one quarter of those who had seen adverts could not remember or did not know what it was about (25 percent).
This is reflective of the findings in 2022.
Figure 30: Nature of gambling adverts seen

Figure 30 information
GC_ADABOUT. And thinking about the last time you saw or heard a gambling advert; do you remember what it was about?
Base: All participants answering who have seen and/or heard any gambling adverts or promotions (2,040).
Note: This is a multiple response question, so the responses shown will not add up to 100 percent.
| Nature of gambling advert | Percentage who have seen (multiple response question, therefore answers do not sum to 100 percent). |
|---|---|
| Lotteries | 43% |
| Betting | 36% |
| Bingo | 35% |
| Online slots and/or casinos | 29% |
| Can’t remember | 16% |
| Don’t know | 9% |
| Other | 1% |
There were also some differences by gender in the content of gambling adverts that young people had last seen. For example, girls were more likely than boys to have last seen an advert about the lottery (48 percent, compared with 39 percent), or bingo (40 percent compared with 29 percent). Whereas boys were more likely than girls to have last seen an advert about betting (43 percent, compared with 29 percent of girls) and online slots or casinos (31 percent, compared with 25 percent).
There were some notable age differences regarding the content of gambling adverts that young people had last seen, with 17 year olds more likely to have seen a betting advert than those aged 11 to 13 years old or 14 to 16 years old (56 percent compared to 29 percent and 39 percent). Those aged 14 to 16 years old are more likely than 11 to 13 year olds to have last seen an advert about betting (39 percent compared with 29 percent) or online slots and casinos (32 percent compared with 25 percent).
Whether ever prompted to gamble by adverts and promotions
Among young people who have ever seen or heard any gambling advert or sponsorship, the vast majority (81 percent) said that it did not prompt them to spend money on gambling when they did not otherwise plan to.
However, 7 percent say that the advert or sponsorship did prompt them to gamble, increasing to 13 percent of 11 to 17 year olds who have spent their own money on gambling in the last 7 days.
These figures remain unchanged in comparison to 2022.
Figure 31: Whether adverts or promotions about gambling ever prompted young people to gamble
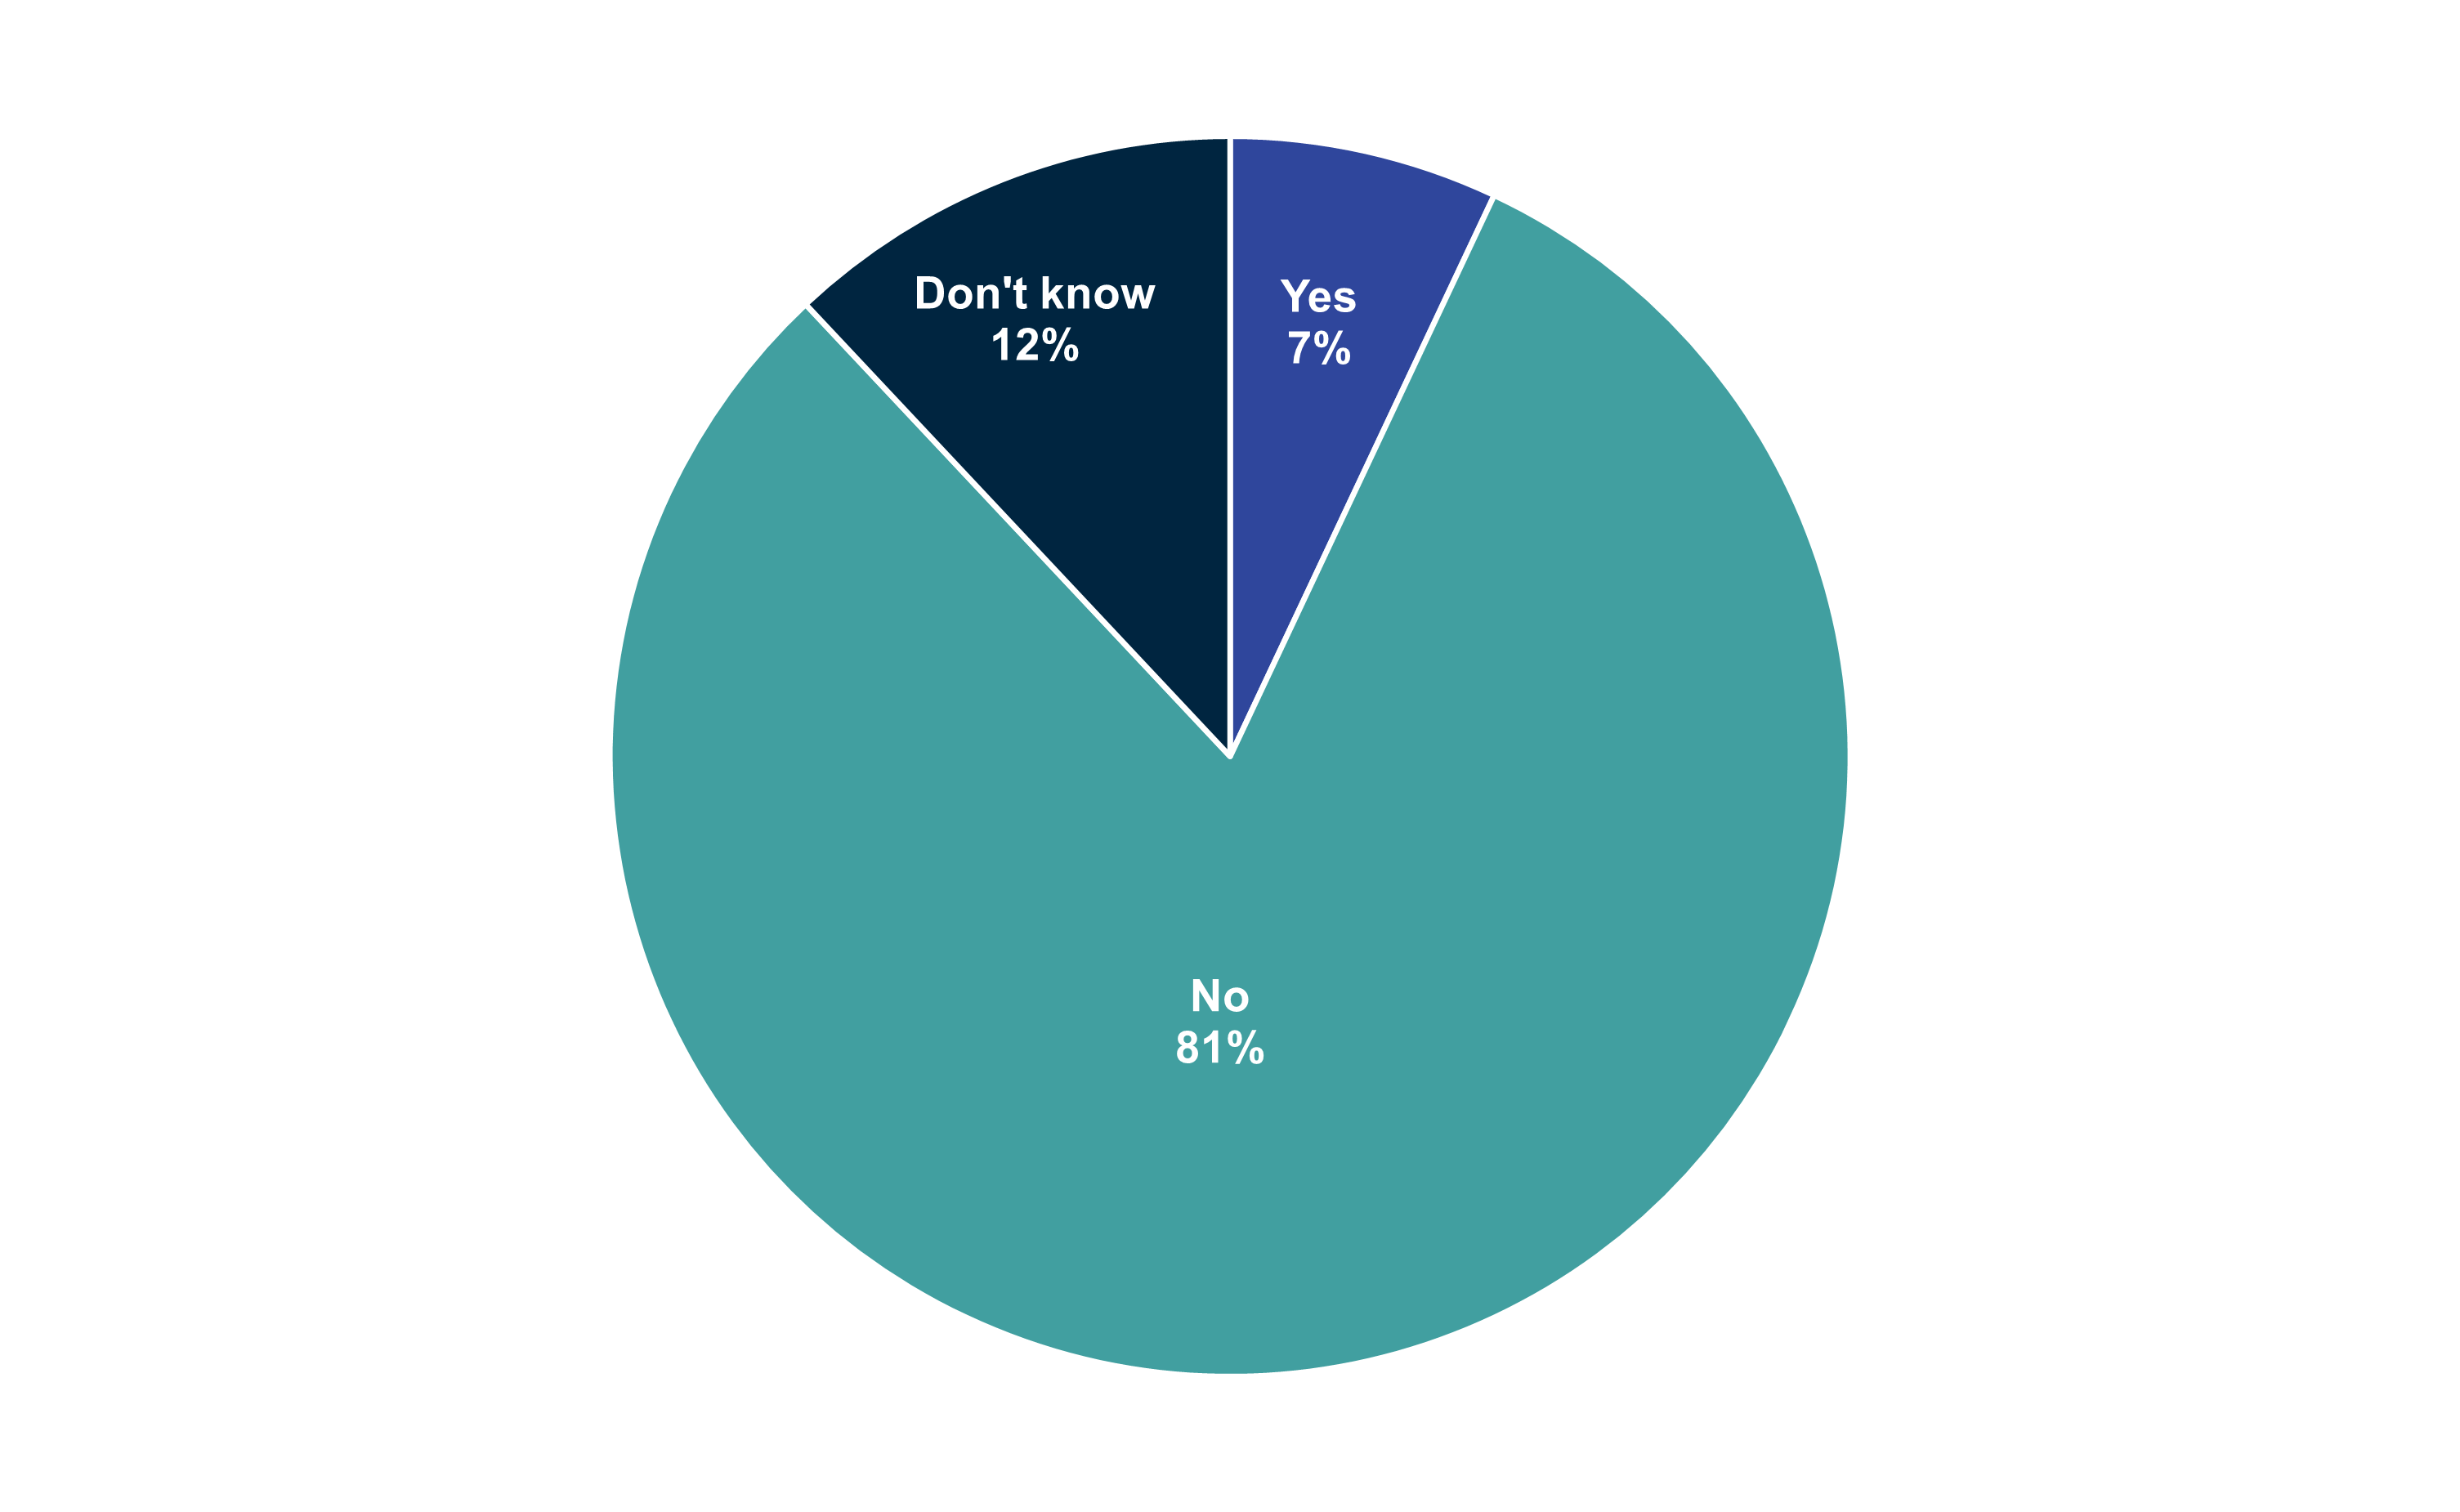
Figure 31 information
GC_ADSPEND. Have adverts or promotion about gambling ever prompted you to spend money on gambling when you were not otherwise planning to?
Base: All participants answering who have seen and/or heard any gambling adverts or promotions (2,028).
| Response | Percentage who have been prompted to gamble by adverts or promotions |
|---|---|
| Yes | 7% |
| No | 81% |
| Don't know | 12% |
Following gambling companies on social media
A minority of young people (15 percent) said that they followed gambling companies on social media websites, typically using YouTube (10 percent), followed by TikTok (9 percent) and Instagram (7 percent).
Figure 32: Exposure to gambling on social media

Figure 32 information
GC_SOCIALMED. Do you follow any gambling companies on any of the following social media or streaming platforms?
Base: All participants answering (2,650).
Note: This is a multiple response question, so the responses shown will not add up to 100 percent.
| Response | Percentage who have seen (multiple response question, therefore answers do not sum to 100 percent) |
|---|---|
| Yes, on YouTube | 10% |
| Yes, on TikTok | 9% |
| Yes, on Instagram | 7% |
| Yes, on Snapchat | 5% |
| Yes, on Facebook | 4% |
| Yes, on Twitter | 4% |
| Yes, on Twitch | 4% |
| No, I don’t follow any gambling on social media and/or streaming platforms | 68% |
| No, I don’t use social media and/or streaming platforms | 3% |
| Don’t know/can’t remember | 13% |
In line with differences in rates of gambling, boys were more likely than girls to follow gambling companies on social media (18 percent, compared with 12 percent). This is consistent with the finding that boys were more likely than girls to have seen adverts on social media.
Young people who had spent their own money on gambling in the last 7 days and 13 year olds were more likely to follow gambling companies on social media or streaming platforms (28 percent and 19 percent, respectively, compared with the overall figure of 15 percent). 17 year olds were less likely to follow any gambling companies on social media and/or streaming platforms, compared to 11 to 13 year olds and 14 to 16 year olds (73 percent, compared to 64 percent and 71 percent, respectively).
The amount of young people who followed gambling companies on social media has increased by 2 percentage points in comparison to 2022 (13 percent). Boys are also 2 percentage points more likely to follow these pages in comparison to 2022 (16 percent).
Appendices
Applying the DSM-IV-MR-J problem gambler screen
The DSM-IV-MR-J (Diagnostic and Statistical Manual of Mental Disorders 4th Edition - Multiple Response Juvenile) screen is applied to assess whether respondents who gamble are defined as experiencing problems with their gambling. In the adolescent gambling field, this is one of the most widely used instruments to assess experience of problem gambling among this age group1.
A two-step eligibility criteria were used in applying the DSM-IV-MR-J screen. Firstly, respondents had to indicate that they had spent their own money on at least one gambling activity on at least one occasion in the last 12 months to answer all of nine components of the problem gambling screener. A full list of gambling activities can be found in Table A.1. Secondly, young people who answered ‘prefer not to say’ throughout the gambling screen were excluded.
In total 890 individuals qualified for the gambling screen.
Points were then awarded to each respondent based on the answers they gave to the nine components (or questions) which are used to define typologies of gamblers, as set out in Table A.1.
The screen questions use frequency scales of ‘Never’, ‘Once or twice’, ‘Sometimes’ or ‘Often’. Each respondent scores a point for each of the nine criteria that they met. If the respondent has undertaken four or more of the behaviours and/or actions, they receive a score of four or more and they are classified as a ‘problem gambler’. A score of two or three points identifies respondents as ‘at-risk gamblers’ and a score of zero or one indicates a ‘non-problem gambler’.
Table A.1 indicates how the questions asked in 2023 mapped onto the DSM-IV-MR-J problem gambling screen components and the percentage of young people who gave the required answers to each question when the scoring system was applied to the data.
Table A.1: Problem and non-problem gambler criteria from the DSM-IV-MR-J screen
| 2023 question name | DSM-IV criteria | Question wording: ‘In the past 12 months …’ | If any of the following answer criteria are ticked, that qualifies as 1 point | Young people scoring | |
|---|---|---|---|---|---|
| Percentage | Number of participants | ||||
| GC_PREOCC | Pre-occupation | How often have you found yourself thinking about gambling or planning to gamble | ‘Often’ | 0.7% | (23) |
| GC_ESCAPE | Escape | How often have you gambled to help you escape from problems or when you are feeling bad | ‘Sometimes’ or ‘often’ | 1.1% | (38) |
| GC_WITHD | Withdrawal | Have you felt bad or fed up when trying to cut down on gambling | ‘Sometimes’ or ‘often’ | 0.9% | (31) |
| GC_TOLERNCE | Tolerance | Have you needed to gamble with more and more money to get the amount of excitement you want | ‘Sometimes’ or ‘often’ | 1.5% | (52) |
| GC_LOSSCON | Loss of control | Have you ever spent much more than you planned to on gambling | ‘Sometimes’ or ‘often’ | 1.4% | (50) |
| GC_TAKEN MONEY | Taken money | Have you ever taken money from any of the following without permission to spend on gambling: dinner money or fare money, money from family, money from things you’ve sold, money from outside the family, somewhere else | If any one or more of these options are ticked, then qualifies for one point in total | 1.4% | (47) |
| GC_LEDRISKED | Risked relationships | Has your gambling ever led to the following: a) arguments with family or friends or others, c) missing school | If any of the following are ticked, then qualifies for one point in total: ‘once or twice’, ‘sometimes’ or ‘often’ | 1.3%, 0.5% | (46), (17) |
| GC_LEDLYING | Lying | Has your gambling ever led to the following: b) Telling lies to family or friends or others | ‘Once or twice’ ‘sometimes’ or ‘often’ | 1.2% | (37) |
| GC_CHASING | Chasing | After losing money by gambling, have you returned another day to try to win back the money you lost | ‘More than half the time’ or ‘every time’ | 0.8% | (28) |
Small base sizes mean that these findings should be viewed with caution, they also prevent sub-group analysis of the young people defined under each component.
All percentages are shown based on the full sample of 3,453 11 to 17 year olds.
1 Fisher, S (2000). Developing the DSM-IV Criteria to Identify Adolescent Problem Gambling in Non-Clinical Populations, Journal of Gambling Studies Volume 16 No. 2/3.
Research design
Trend data
Since 2011, the Gambling Commission and Ipsos have conducted an annual survey into the gambling behaviours of young people aged 11 to 16 years old in Great Britain. In 2023, we extended this to include 17 year olds. This report delivers the results from the 2023 survey, which explores young people’s current rates of participation in gambling.
Sampling
The Young People Omnibus (YPO) survey aims to represent pupils in curriculum years 7 to 12 (S1 to S6 in Scotland).
The survey invites pupils to take part who are attending academies (public funded schools held accountable through a legally binding ‘funding agreement’ in England) and maintained (overseen, or ‘maintained’ by the Local Authority) secondary and middle-deemed secondary schools in England, Wales and Scotland. The 2023 survey also invited independent schools (schools who charge fees to attend instead of being funded by the government and do not have to follow the national curriculum) to participate.
To enable this a three-stage sampling process was used:
- In England and Wales, a sample of schools was selected from Department for Education’s ‘Get Information About Schools’ database (a comprehensive listing of secondary schools in England and Wales). Special schools were excluded. The sample frame was stratified by Government Office Region (GOR), and, within each stratum, schools were selected proportional to the number of pupils attending the school. In England and Wales, 617 schools were selected to participate in the survey. In Scotland, a sample of 37 schools was selected from the Scottish Government’s school contacts database. The sample was stratified by local authority and school size. Therefore, across all three regions, 654 schools were selected to participate in the survey.
- Two curriculum year groups (between Year 7 and Year 12 for England and Wales and between S1 and S6 in Scotland) were selected at random for each school.
- In each specified curriculum year group, schools were asked to nominate one mixed ability class to take part. Schools were also given the opportunity to provide additional classes and year groups. All members of the randomly selected class group were selected to fill out the self-completion survey.
Recruiting schools
To maintain comparability, the sampling of schools has remained consistent year on year. However, in 2023 Year 12 pupils and independent schools were included for the first time. The way in which schools are recruited has evolved to respond to technological developments and most recently in respect to the demands that were placed on schools during the coronavirus (COVID-19) pandemic.
Advance packs
All schools in the main sample for England and Wales received an invitation pack across February and March. The pack included a letter informing them about the survey, a leaflet containing more information on how the data is used and contact details for the Ipsos Young People Omnibus team. The packs are addressed to a named head teacher.
In Scotland, the first step was to send a letter to local authorities which contain schools in the sample frame. Local authorities were informed about the survey and given the option to opt out of the research, on behalf of schools in their area. In total 23 Scottish local authorities were contacted, and 10 opted out of the survey. Selected schools in the remaining 13 local authorities were then sent the invitation letter and information sheet.
Contacting schools
Schools’ recruitment at Ipsos is managed by a team of experienced recruiters. In mid-February, the Ipsos Young People Omnibus research team conducted a briefing via teams to inform recruiters about the survey content, update them of any changes, and share ideas and tips for encouraging participation.
Recruiters were allocated sample in batches, which contains a mix of regions (to avoid bias). The sample included contact details for the school. Where possible, recruiters sought to enrich this by looking at the school website to try and obtain a named contact or direct email address.
Recruiters made contact with all schools in their sample to a) gain headteacher consent for the school to participate, b) collect contact details for a liaison person within the school (usually the teacher for a selected class), c) select one class from each nominated curriculum year group for the school, and d) arrange a time and date when each class will take part in the online survey.
Recruiters managed this process by using an electronic booking system, which the research team also access to monitor the response rate.
Over the years incentives have become an essential addition to protecting the response rate, particularly in London. They also help encourage schools to choose to participate in the Young People Omnibus over other surveys, which offer cash incentives. In 2023, all schools participating in the Young People Omnibus were offered a £100 cash incentive. As fieldwork progressed, to encourage participation, this incentive was doubled to £200. Schools were also given a teaching pack, containing free data and example exercises to use in their classes, and an infographic A3 poster highlighting key findings from YPO surveys to display in class.
Once a school agreed to participate, a confirmation email was sent, providing schools with their individual online survey link, a template for letters to parents and further information to administer the survey.
Fieldwork for the study was conducted from February to July 2023.
Response rate
In total, from a sample frame of 654 schools in England, Scotland and Wales, 69 took part in the 2023 YPO survey, giving a school response rate of 11 percent.
Overall, 3,453 pupils aged 11 to 17 years old from 105 class groups completed the survey online: an average of 33 pupils per class.
The school response rate has decreased gradually year-on-year. In 2022, the survey was particularly low as a result of the coronavirus pandemic and specifically the omicron wave which affected schools after Christmas 2021. The effects of this were still felt in 2023 and number of schools recruited continued to be low.
The following table provides details of the number of telephone calls recruiters made to individual schools:
Table A.2: Number of telephone calls for purposes of school recruitment
| Number of calls made | Number of schools |
|---|---|
| Under 5 | 10 |
| 5 to 10 | 36 |
| Over 10 | 19 |
Of the schools who did refuse to take part, the most common reason given was that they were too busy to be part of the survey – citing reasons such as demands from other school surveys, disruption of teaching, and high teacher workload.
Weighting
Data are weighted by gender, age and region. The weights were derived from data supplied by the following sources:
- for England, the Department for Education: ‘Schools pupils and their characteristics 2021 – national tables’. See National statistics: Schools, pupils and their characteristics: January 2021 on GOV.UK (opens in new tab)
- for Wales, StatsWales. See StatsWales: Pupils by year group and sex (opens in new tab)
- for Scotland, Scottish Government’s school contacts database. See Scottish Government: School contact details. (opens in new tab)
The effect of weighting is shown in the sample profile section of the Appendices.
Statistical reliability
The respondents to the questionnaire are only samples of the total population, so we cannot be certain that the figures obtained are exactly those we would have if everybody had been interviewed (the true values). We can, however, predict the variation between the sample results and the true values from knowledge of the size of the samples on which the results are based and the number of times that a particular answer is given. The confidence with which we can make this prediction is usually chosen to be 95 percent - that is, the chances are 95 in 100 that the true value will fall within a specified range. Table A.3 illustrates the predicted ranges for different sample sizes and percentage results at the 95 percent confidence interval.
Table A.3: Approximate sampling tolerances by sample size
| Size of sample on which survey results is based | Approximate sampling tolerances applicable to percentages at or near these levels | ||
|---|---|---|---|
| 10 or 90 percent | 30 or 70 percent | 50 percent | |
| Plus or minus | Plus or minus | Plus or minus | |
| 100 interviews | 6 | 9 | 10 |
| 500 interviews | 3 | 4 | 4 |
| 1,000 interviews | 2 | 3 | 3 |
| 2,599 interviews (Young People Omnibus respondents, 2022) | 1 | 2 | 2 |
For example, with a sample of 3,453 where 30 percent give a particular answer, the chances are 95 in 100 that the 'true' value (which would have been obtained if the whole population had been interviewed) will fall within the range of plus or minus 2 percentage points from the sample result.
Strictly speaking the tolerances shown here apply only to random samples, although they offer an approximation for the complex design used by the current study.
When results are compared between separate groups within a sample, different results may be obtained. The difference may be 'real', or it may occur by chance (because not everyone in the population has been interviewed). To test if the difference is a real one - that is, if it is 'statistically significant', we again have to know the size of the samples, the percentage giving a certain answer and the degree of confidence chosen. If we assume the '95 percent confidence interval', the differences between the two sample results must be greater than the values given in the Table A.4.
Table A.4: Differences required for significance
| Size of sample compared | Differences required for significance at or near these percentage levels | ||
|---|---|---|---|
| 10 or 90 percent | 30 or 70 percent | 50 percent | |
| Plus or minus | Plus or minus | Plus or minus | |
| 100 and 100 | 8 | 13 | 14 |
| 250 and 100 | 7 | 11 | 12 |
| 500 and 250 | 5 | 7 | 8 |
| 500 and 500 | 4 | 6 | 6 |
| 1,000 and 500 | 3 | 5 | 5 |
| 1,000 and 1,000 | 3 | 4 | 4 |
| 1,500 and 1,000 | 2 | 4 | 4 |
Sample profile
Table A.5 outlines the details of the sample profile for the 2023 study; covering all 11 to 17 year olds who participated in the Young People Omnibus.
Table A.5 - Sample profile 2023
| Sample group | Unweighted (number) | Unweighted (percentage) | Weighted (percentage) |
|---|---|---|---|
| Total | 3453 | 100% | 100% |
| Gender of pupils | |||
| Male | 1593 | 46% | 48% |
| Female | 1660 | 48% | 47% |
| Non-binary | 76 | 2% | 2% |
| In another way | 43 | 1% | 1% |
| Prefer not to say | 81 | 2% | 2% |
| Age of pupils | |||
| 11 | 94 | 3% | 3% |
| 12 | 654 | 19% | 19% |
| 13 | 836 | 24% | 19% |
| 14 | 719 | 21% | 19% |
| 15 | 680 | 20% | 22% |
| 16 | 167 | 5% | 10% |
| 17 | 284 | 8% | 6% |
| Year of pupils2 | |||
| 7 | 554 | 16% | 19% |
| 8 | 903 | 26% | 20% |
| 9 | 684 | 20% | 19% |
| 10 | 783 | 23% | 18% |
| 11 | 167 | 5% | 16% |
| 12 | 359 | 10% | 7% |
| Ethnic origin | |||
| White | 2666 | 77% | 76% |
| Black and Minority Ethnic (BME) | 724 | 21% | 22% |
| Region | |||
| London | 269 | 8% | 14% |
| South East | 814 | 24% | 15% |
| South West | 132 | 4% | 8% |
| North East | 224 | 7% | 4% |
| North West | 317 | 9% | 11% |
| East of England | 336 | 10% | 10% |
| East Midlands | 241 | 7% | 8% |
| West Midlands | 461 | 13% | 10% |
| Yorkshire and Humberside | 228 | 7% | 9% |
| Scotland | 239 | 7% | 7% |
| Wales | 192 | 6% | 4% |
Profile of schools
In this section we analyse how the sample of participating schools compares with the population of schools that are eligible for YPO (that is, maintained secondary schools in England, Wales and Scotland). The information for England and Wales is drawn from Department of Education’s ‘Get Information About Schools’ database, and the equivalent for Scotland. Less detailed information is available on the sampling frames for schools in Wales and Scotland, and the analysis is based on the information available for each country for each variable. We analyse the profiles of schools for a range of variables, including school type; regional distribution; urban or rural profile; and proportion of pupils eligible for free school meals.
Type of establishment
Figures for type of establishment are shown below. The proportions in the population and starting sample are similar. There is a slight over-representation in the proportion of academies, and a slight under-representation of independent schools and free schools, which was corrected by weighting the data. However, in practice, free schools are very similar to academies, so this is unlikely to introduce any bias in the sample.
Table A.6: Profile of school type for school population and Young People Omnibus (YPO) starting and/or participating sample
| School type | Percentage of population (all schools eligible to be sampled) | Percentage of all schools sampled for YPO 2022 | Percentage of schools participating in YPO 2022 |
|---|---|---|---|
| Academies | 54% | 66% | 62% |
| Free schools | 7% | 4% | 4% |
| Local authority maintained schools | 14% | 17% | 16% |
| Independent schools | 12% | 4% | 1% |
| Welsh schools | 5% | 5% | 6% |
| Scottish schools | 9% | 5% | 10% |
The regional breakdown of the population, starting sample, and participating sample is shown below. The participating sample over-represents schools in the North East and South East compared with the starting sample and population, and slightly under-represents schools in the East Midlands, London, and North West.
Table A.7: Regional profile for school population and Young People Omnibus (YPO) starting and/or participating sample
| Region | Percentage of population (all schools eligible to be sampled) | Percentage of all schools sampled for YPO 2022 | Percentage of schools participating in YPO 2022 |
|---|---|---|---|
| East Midlands | 7% | 8% | 4% |
| East of England | 9% | 10% | 10% |
| London | 13% | 15% | 10% |
| North East | 4% | 4% | 9% |
| North West | 13% | 12% | 10% |
| Scotland | 9% | 5% | 10% |
| South East | 13% | 15% | 16% |
| South West | 8% | 9% | 6% |
| Wales | 5% | 5% | 6% |
| West Midlands | 11% | 11% | 13% |
| Yorkshire and the Humber | 8% | 8% | 6% |
| Total (number) | 3241 | 657 | 69 |
The distribution of urban and rural schools in England, Scotland and Wales is consistent between the sample and participating schools. However, this slightly over-represents those in urban areas with 91 percent of participating schools being located in urban areas compared with 85 percent of the population.
Table A.8: Rural and/or urban profile for school population and Young People Omnibus (YPO) starting and/or participating sample
| Urban or rural | Percentage of population (all schools eligible to be sampled) | Percentage of all schools sampled for YPO 2023 | Percentage of schools participating in YPO 2022 |
|---|---|---|---|
| All urban | 85% | 91% | 91% |
| All rural | 15% | 9% | 9% |
The table below shows the average percent eligible for free school meals in England and Wales. The figures for the population, starting sample and participating sample are broadly comparable.
Table A.9: School size, and average percentage pupils eligible for free school meals for school population and Young People Omnibus (YPO) starting and/or participating sample
| Data definitions | Percentage of population (all schools eligible to be sampled) | Percentage of all schools sampled for YPO 2023 | Percentage of schools participating in YPO 2023 |
|---|---|---|---|
| Average percentage free school meals (England and Wales) | 15% | 16.53% | 17.18% |
The sample of schools participating in YPO 2023 is broadly representative of the population, with a similar profile in terms of types of establishment, regions, free school meals, and urbanity profile. There were some differences in the profile of our achieved sample compared with the population, but weights applied to the data will correct for any bias this might have introduced to the findings.
2 Or equivalent year groups in Scotland.
List of gambling activities and definitions
List of gambling activities
The survey contained four questions which were designed to identify gambling experience and then establish rates of active involvement among young people during the past seven days, four weeks, 12 months and more than 12 months ago.
All young people were asked whether they had ever participated in any gambling activities shown on a list. For each activity they had ever participated in, they were then asked when they did so, whether they had spent their own money on it and when they last spent their own money.
The list of gambling activities which formed the basis of the gambling prevalence questions is shown in Table A.10.
Table A.10: List of gambling activities
- National Lottery draw, for example Lotto, EuroMillions or Set for Life, either with a physical ticket or playing online.
- National Lottery Scratchcards (not free Scratchcards).
- National Lottery online instant win games.
- Other Lotteries (for example The Health Lottery, People’s Postcode Lottery, or other smaller lotteries).
- Played arcade gaming machines (for example penny pusher or claw grab machine).
- Played fruit or slot machines (for example at an arcade, pub or social club).
- Played gambling machines in a betting shop.
- Played cards for money (for example with friends or family).
- Played bingo at a bingo club.
- Played bingo at somewhere other than a bingo club (for example social club, holiday park).
- Played bingo online (for example Foxy Bingo, Gala Bingo or Tombola).
- Placed a bet for money between friends or family.
- Placed a bet on eSports (electronic sports that is, playing video games competitively) online.
- Placed a bet at a betting shop or bookies (for example on football or horse racing).
- Placed a bet on a betting website and/or app (for example on football or horse racing).
- Played a game inside a casino.
- Played casino games online (for example, online poker or online roulette for money).
Definitions
Table A.11 provides definitions for terms referenced throughout the report.
Regulated forms of gambling - Those gambling activities which are licensed and regulated by the Gambling Commission including betting or casino gaming provided by a licensed operator online or from premises, playing the National Lottery or other lottery products. This categorisation also includes playing of gaming machines in betting shops, bingo premises, casinos or arcades. Due to different categories and requirements relating to gaming machines this report will include some gaming machine play which is not directly regulated by the Gambling Commission and in some incidences can be legally played by children and young people.
Unregulated forms of gambling – Those gambling activities which fall outside the remit of the Gambling Commission such as non-commercial gambling between friends and family or playing bingo somewhere other than a bingo club.
Esports- short for electronic sports, Esports is the competitive playing of video, particularly between professional players, individually or as teams