- Print the full document
- Save the page as a HTML document to your device
- Save the page as a PDF file
- Bookmark it - it will always be the latest version of this document
This box is not visible in the printed version.
Illegal gambling - Findings from an open banking data analysis
An analysis of directly observed illegal gambling transactions in anonymised banking transaction data linked to individuals’ survey responses.
Published: 28 October 2026
Last updated: 28 October 2026
This version was printed or saved on: 28 October 2026
Online version: https://www.gamblingcommission.gov.uk/report/illegal-gambling-findings-from-an-open-banking-data-analysis
Introduction
Keeping crime out of gambling is one of the statutory objectives of the Gambling Commission and tackling the illegal market is a key workstream contributing to this. As part of our strategic objective to use data and analytics to make gambling regulation more effective, we have been conducting research to learn more about the illegal market using a range of data sources including surveys, estimated web traffic data and here with financial transaction data.
This report sets out how we have used anonymised banking transaction data to start to help us further understand the characteristics of some of the people who use the illegal market and the harm that they may be suffering, as well as the financial context of how payments from individuals to illegal operators are made.
Key findings include examples of individuals engaging simultaneously with the licensed and illegal market, a higher proportion of people scoring 8 or more on the Problem Gambling Severity Index (PGSI) among people who we know use the illegal market and low rates of credit card use for the transactions that we have detected with illegal operators.
Results
An initial attempt to identify transactions with illegal operators by searching for the names of known illegal operators using 'fuzzy matching' to transaction descriptions in our open banking dataset failed. This may indicate that illegal operators, unlike most legitimate businesses, rarely or never include their name in the information that they provide to payment providers.
A second attempt to identify transactions with illegal operators was made searching for exact matches between transaction descriptions in our data and descriptions taken from bank statements containing transactions that we know are with illegal gambling operators. This succeeded in identifying 821 transactions that we believe to be between British residents and illegal gambling companies.
A third exercise then took place to identify further transactions based on exact matching of the 'merchant name' field in our data with names that have been used in transactions that are strongly suspected to be with illegal operators. This identified 2,628 transactions, 23 of which were also identified by the second activity. For context, the overall dataset contains a total of 4.8 million transactions with licensed non-lottery gambling companies and 157.2 million transactions overall. The data was collected from a wider panel of individuals who had provided their explicit consent for their banking data to be used for research, before being anonymised and purchased by the Gambling Commission. It is not a nationally representative sample with some groups over-represented and some groups under-represented, as discussed in the limitations section.
The 3,426 unique transactions identified by these exercises were made by 179 different individuals in the data, who had an average age of 44 years old and 115 of whom were male. As our transaction data is from an existing panel, we have Problem Gambling Severity Index (PGSI) scores for 146 of these individuals.
Analysis of these 179 individuals’ transactions indicates that illegal gambling transactions typically occur within broader patterns of on-going legal gambling activity. Among those with repeated detected illegal transactions, 91% also engage with licensed gambling operators, indicating substantial overlap between the two.
Figure 1 shows the average number of transactions with licensed gambling operators in the months leading up to and following an individual’s first detected transaction with an illegal operator. It demonstrates that transactions with identified unlicensed operators comprise a small proportion of individuals’ total gambling transactions in the months following initial engagement with the illegal market. It does not show a substantial shift away from the licensed market following individuals first known engagement with an unlicensed operator.
Figure 1: The mix of transactions with licensed and unlicensed operators before and after an initial transaction with an illegal operator
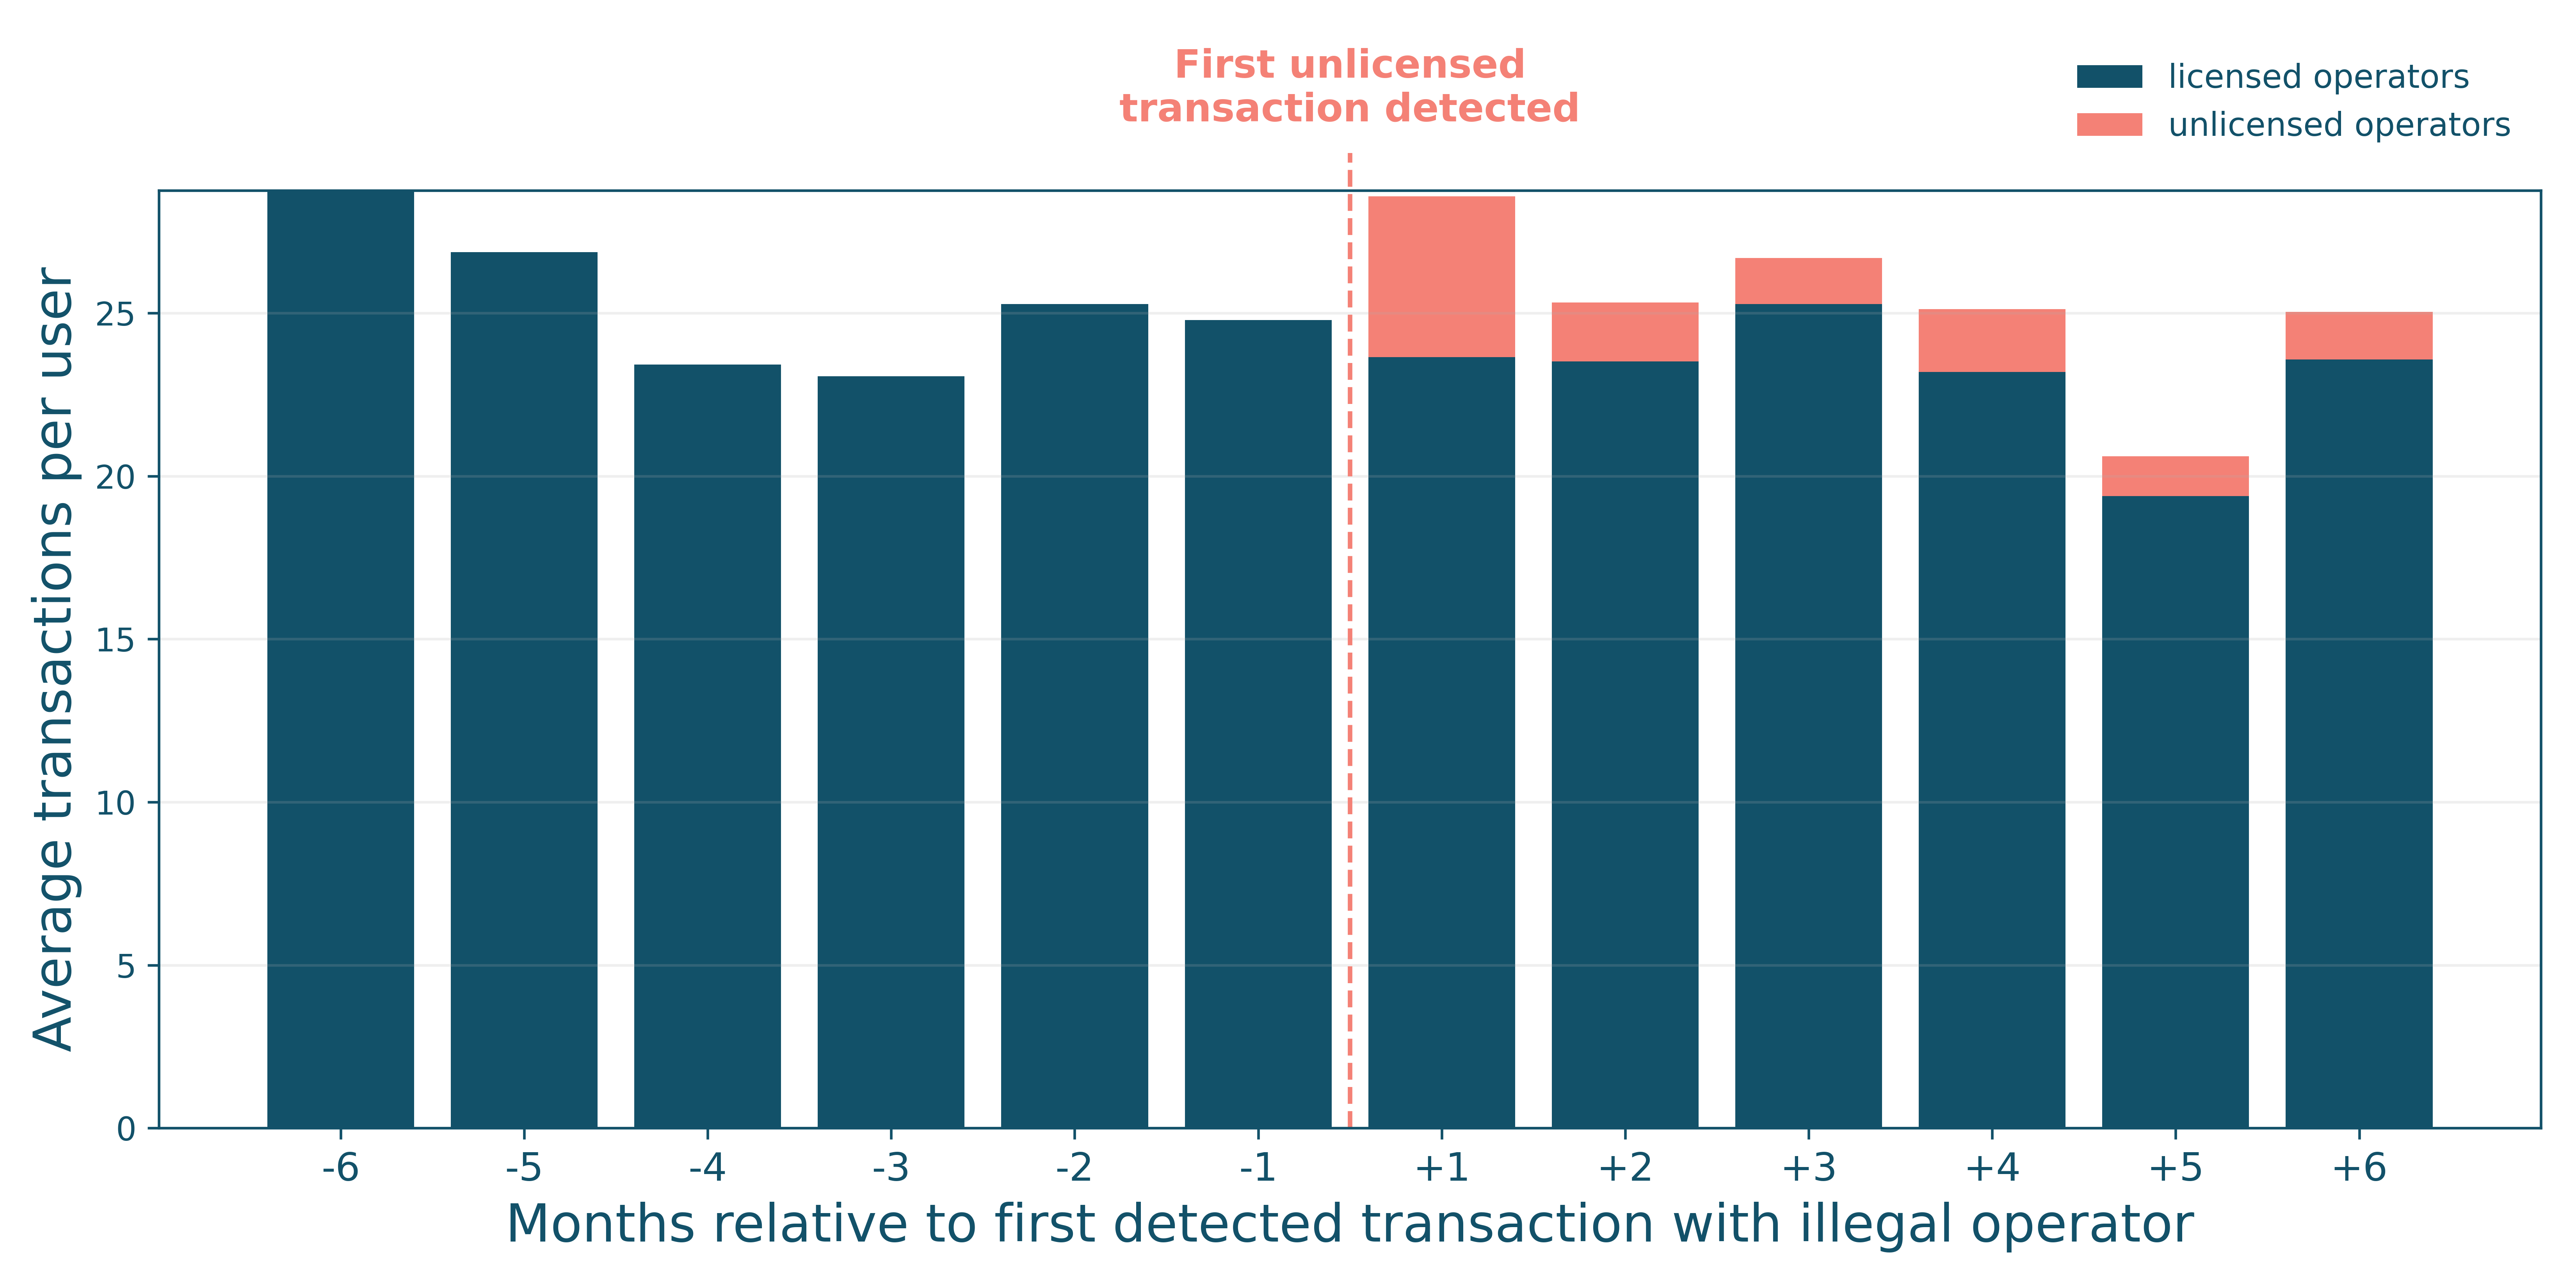
YouGov Finance data. Unique individuals with at least 2 unlicensed transactions. N=122. For the 6 months following the first detected transaction with an illegal operator, the bars are composed of licensed operator transactions on the bottom and unlicensed operator transactions on the top.
| Months relative to first transaction with illegal operator | Average transactions per user with licensed operators | Average transactions per user with unlicensed operators |
|---|---|---|
| 6 months before | 28.8 | 0 |
| 5 months before | 26.9 | 0 |
| 4 months before | 23.4 | 0 |
| 3 months before | 23.1 | 0 |
| 2 months before | 25.3 | 0 |
| 1 month before | 24.8 | 0 |
| 1 month after | 23.7 | 4.9 |
| 2 months after | 23.5 | 1.8 |
| 3 months after | 25.3 | 1.4 |
| 4 months after | 23.2 | 1.9 |
| 5 months after | 19.4 | 1.2 |
| 6 months after | 23.6 | 1.5 |
Detected illegal gambling transactions also tend to appear in clusters, with sequences of consecutive illegal transactions frequently observed within short time periods. Where both legal and illegal transactions are observed, they also often occur within short timeframes. Taken together, these findings suggest that illegal gambling is embedded within existing gambling behaviour rather than triggering a sustained shift away from the licensed market.
Figure 2 shows the proportion of different PGSI categories among individuals for whom we have detected any transaction with an illegal operator alongside those for whom we have detected any non-lottery gambling transaction. A high proportion of those with transactions with illegal operators, 45%, have a PGSI score of 8 or higher, whereas this figure is only 6% among all individuals with any licensed non-lottery gambling transaction in this dataset*.
Figure 2: The proportions of individuals in each PGSI group with a detected unlicensed gambling transaction and overall, respectively, in our sample
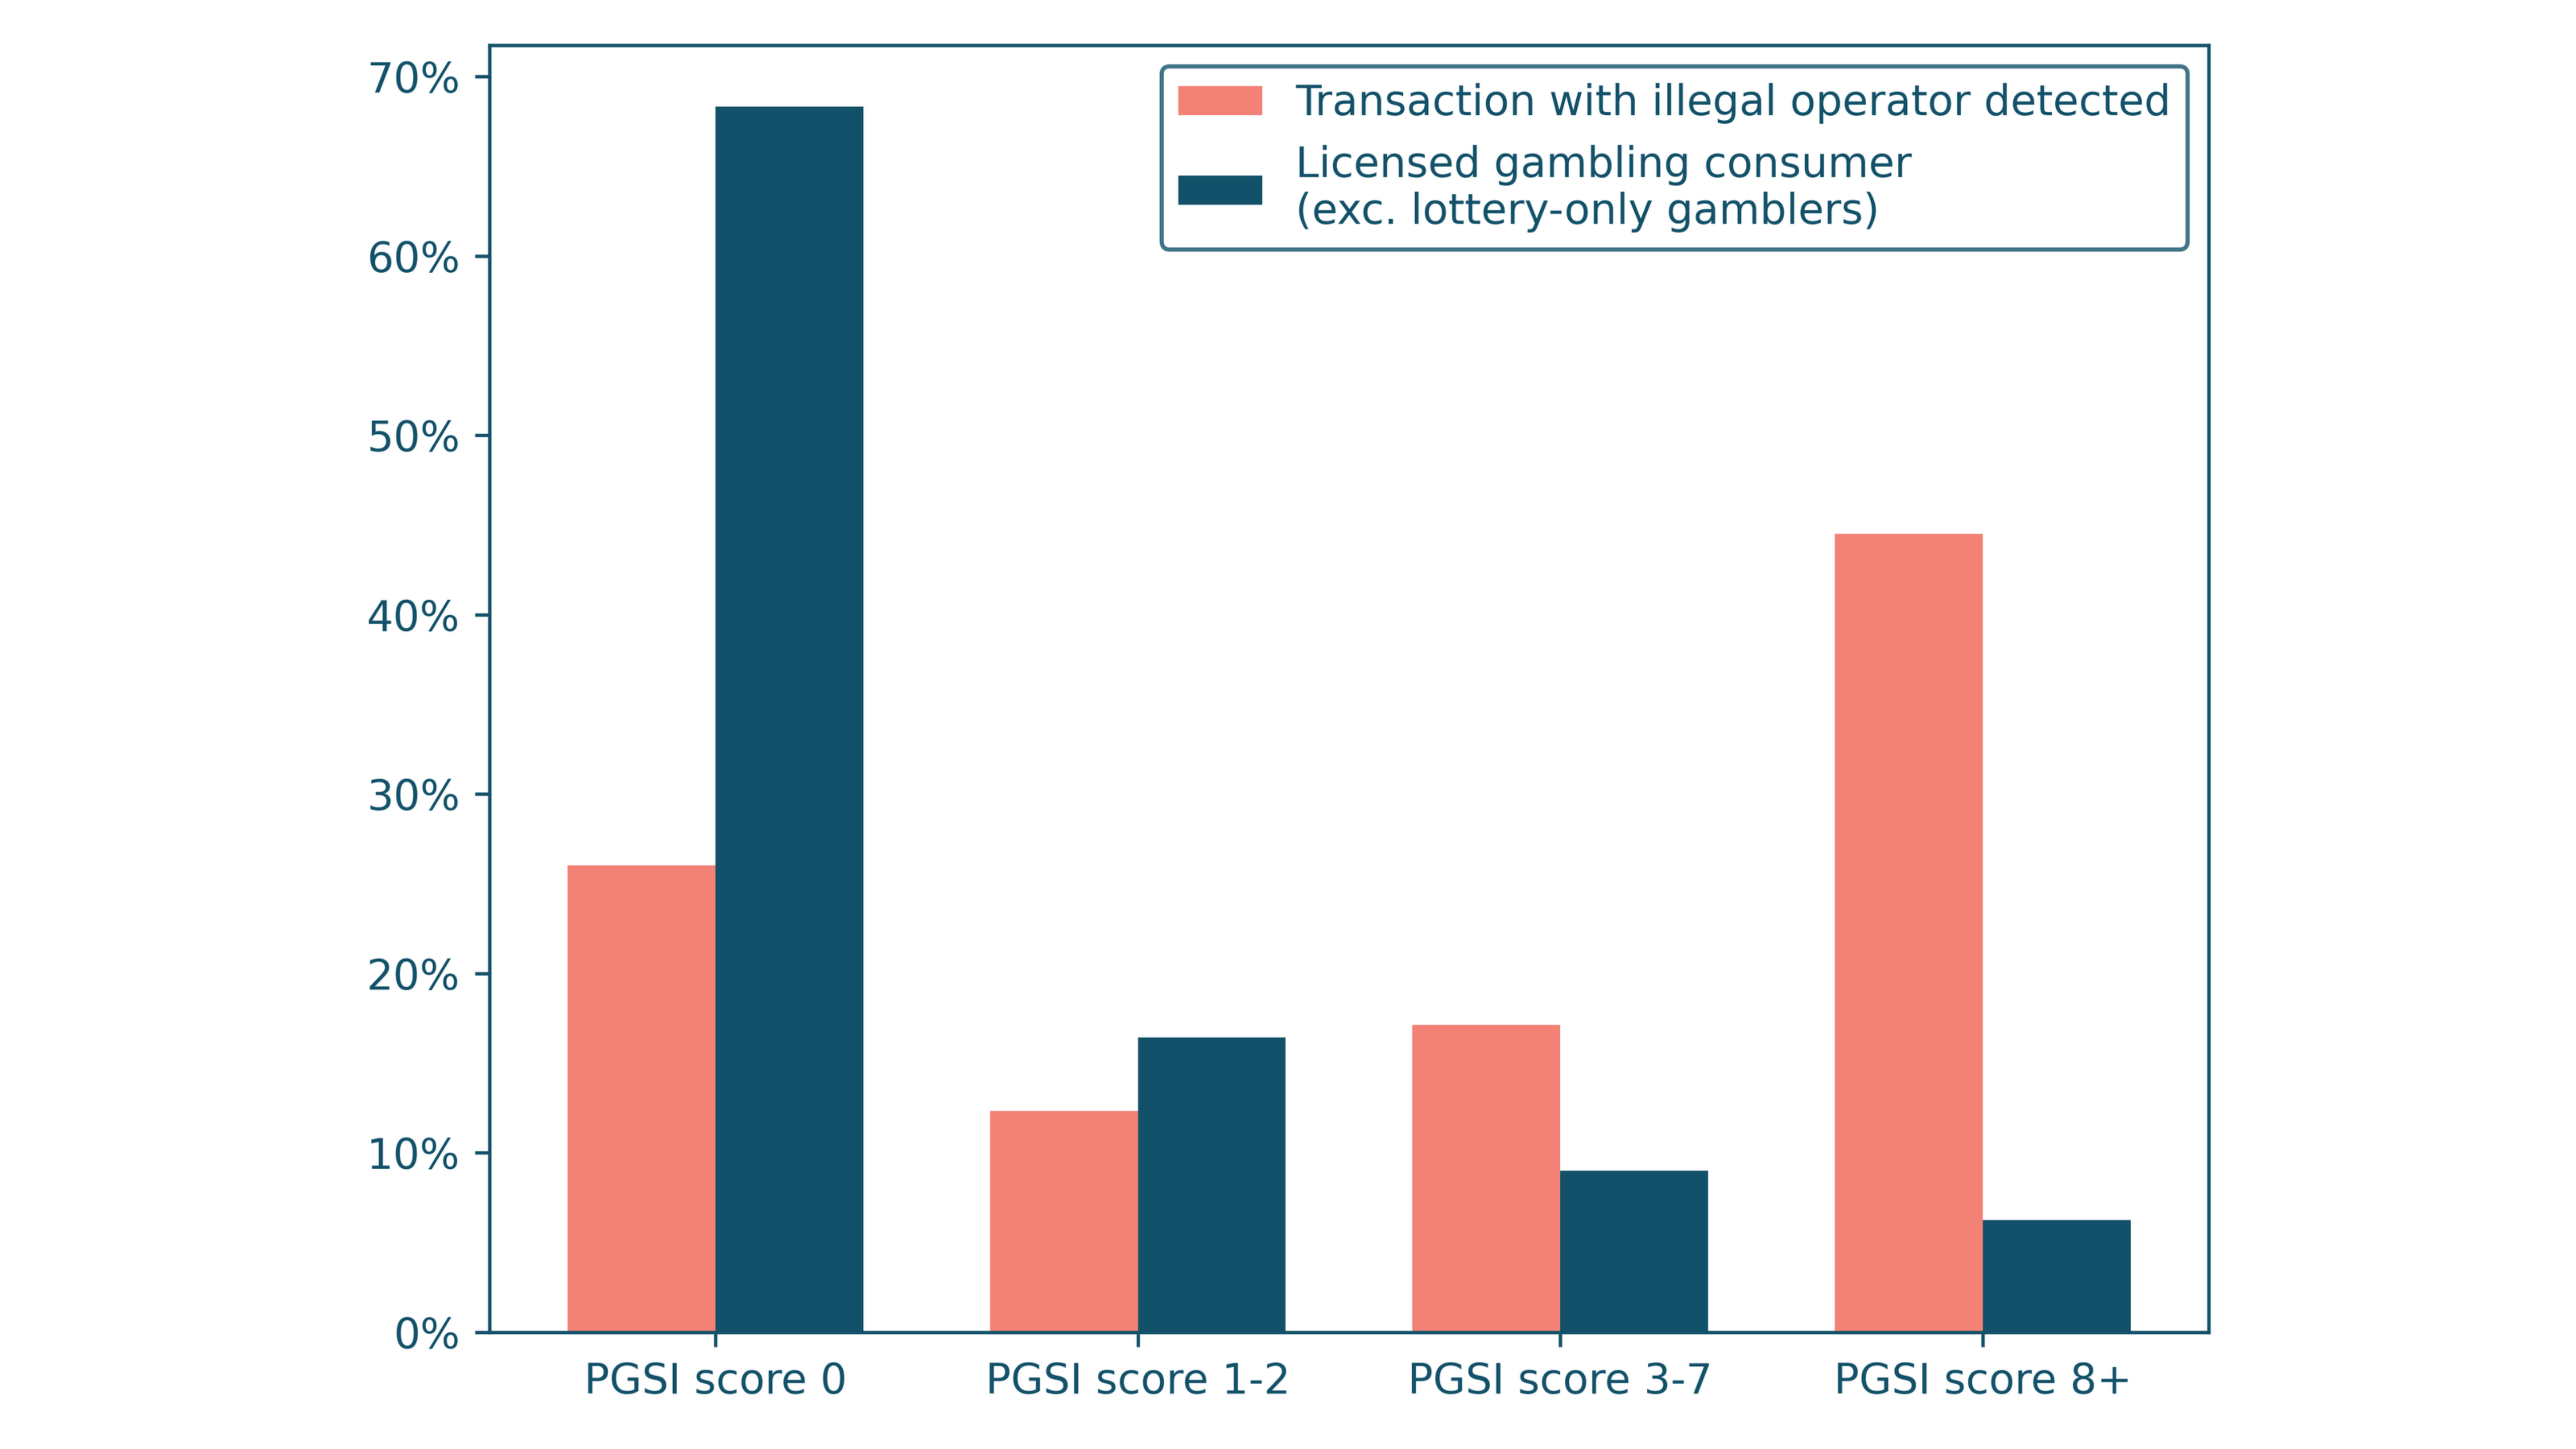
YouGov Finance data. Unlicensed gambling N=146. Licensed gambling N=12,543. The bar on the left of each PGSI group is the individuals who have a transaction with an illegal operator detected. The bar on the right of each group is individuals who are licensed gambling consumers (excluding lottery-only gamblers).
| PGSI group | Transaction with illegal operator detected | All licensed gambling consumers (excluding lottery-only gamblers) |
|---|---|---|
| PGSI score 0 | 26% | 68% |
| PGSI score 1 to 2 | 12% | 16% |
| PGSI score 3 to 7 | 17% | 9% |
| PGSI score 8 or more | 45% | 6% |
The following table sets out the account types used for the transactions with illegal gambling companies. Of these transactions, 4% are made with individuals’ credit card accounts and 15 individuals out of 179 made any debit or credit transactions with these operators using credit card accounts.
Table: Counts of transactions and unique individuals by account type
| Account type | Illegal gambling | |||
|---|---|---|---|---|
| Number of transactions | Proportion of transactions | Number of individuals | Proportion of individuals | |
| Credit card | 138 | 4% | 15 | 8% |
| Transaction (current account) | 3,288 | 96% | 172 | 96% |
*Note that as this dataset is not nationally representative, these PGSI figures can only be used for within-sample comparison and cannot be compared to the corresponding figures in the GSGB.
Materials and methods
Our dataset was gathered by YouGov and comprises Open Banking transactions gathered with informed consent from individuals for them to be used anonymously for research purposes. These records are linked via an anonymised unique identifier for each individual to other information previously collected by YouGov about them. This includes Problem Gambling Severity Index (PGSI) scores for many of the individuals.
The data comes from 38,000 individuals between July 2018 and July 2026. Transactions with licensed operators were identified using a gambling identification algorithm developed by Yaspa, which uses information from regulatory data, test purchasing and a machine learning algorithm to classify the probability that a transaction is with a gambling operator. Transactions were labelled as gambling if this probability was over 0.5. This analysis was conducted using Python and SQL with technical and infrastructure support provided as part of the Gambling Commission’s collaboration agreement with Warwick Business School.
Limitations
This report provides objective evidence on financial transactions between British residents and illegal gambling operators. It provides evidence on gambling harms suffered by some people who use illegal gambling companies, as well as the context and payment types sometimes used in these transactions. However, we note several limitations to this analysis.
First, we note that this evidence is taken from a sample of the overall population that is not nationally representative. The dataset slightly over-represents men and under-represents women, especially women over 55. It also only includes people who have chosen to share their banking data anonymously for research for a small incentive.
Second, we only consider cash transactions from institutions that support open banking protocols. Other types of transactions, for example transactions with unlicensed operators made in cryptocurrencies, are not captured. Also, we only capture transactions with a subset of illegal operators, some of whom are not believed to be currently operating in the Great Britain. Therefore, there may be a significant number of transactions with illegal operators in the dataset that are not identified, including by those individuals for whom we have detected some transactions with illegal operators. This means that the data in this report cannot be used to estimate the size of the illegal gambling market either in absolute terms or in comparison to licensed gambling, where we believe we can identify the vast majority of transactions in this dataset.
Third, despite evidence that individuals interacting with the illegal market are much more likely to have an elevated Problem Gambling Severity Index (PGSI) at some stage, the study design does not permit allow any causal analysis between spending with illegal operators and harm.
Finally, as the methodology in this report relies on the identification of illegal gambling companies via other means, the methods used here cannot be used to proactively identify previously unknown illegal gambling operators.